Why Your Solar Panels Are Losing Power (And How to Catch It Early)
Updated:
Check your solar panel output on a clear day at solar noon and record the voltage reading—this becomes your clean panel baseline. Within two weeks, you’ll likely notice a 2-5% drop in performance even if your panels look relatively clean to the naked eye. That invisible loss is costing you real money and efficiency.
Soiling happens faster than most DIY solar enthusiasts expect. Dust, pollen, bird droppings, and atmospheric pollution create a nearly invisible film that blocks sunlight from reaching your photovoltaic cells. I learned this the hard way during my first year with solar panels—I assumed rain would keep them clean enough, only to discover I was losing nearly 15% of my system’s potential output during dry summer months.
The good news? You don’t need expensive monitoring equipment or professional services to stay on top of panel soiling. With a basic multimeter, a simple cleaning schedule, and about 15 minutes of your time each month, you can detect performance drops before they significantly impact your energy production. Most hobbyists can implement effective soiling monitoring for under $30 in materials.
This guide walks you through practical DIY testing methods that actually work in real-world conditions. You’ll learn how to establish performance baselines, create a monitoring routine that fits your schedule, interpret voltage and current readings to quantify soiling losses, and determine the optimal cleaning frequency for your specific location and climate. Whether you’re dealing with dusty desert conditions, coastal salt spray, or urban pollution, these techniques help you maximize your solar investment without breaking the bank or climbing on your roof every week.
What Soiling Really Means for Your DIY Solar Array
Accumulated dust, pollen, and bird droppings can significantly reduce solar panel efficiency, often going unnoticed until power output drops.
The Surprising Science Behind Soiling Loss
Here’s something I learned the hard way last summer: even a thin layer of dust can seriously impact your solar panel’s performance. I noticed my panels producing 15% less power than usual, and I couldn’t figure out why until I climbed up for a closer look. The culprit? A barely visible film of pollen and dust.
So how does dirt actually steal your solar power? Think of it like putting sunglasses on your panels. When dust, pollen, bird droppings, or other debris settles on the glass surface, it blocks photons (light particles) from reaching the photovoltaic cells underneath. Fewer photons mean fewer electrons get excited, which directly translates to less electricity flowing from your panels.
There are two main types of soiling that affect your system differently. Uniform soiling is when a consistent layer of dust or film covers your entire panel evenly. This creates a gradual, predictable drop in output across the whole array. Localized buildup, on the other hand, happens when debris accumulates in specific spots—like bird droppings on one corner or leaves caught along the bottom edge.
Why does localized buildup matter more? Solar cells are connected in series, meaning they work like a chain. If one cell gets heavily shaded or blocked, it can bottleneck the entire panel’s performance, similar to how one slow car can back up an entire lane of traffic. That single bird dropping might cause disproportionate power loss compared to its tiny size.
Understanding these differences helps you develop smarter cleaning and monitoring strategies for your specific situation.
How Much Power Are You Really Losing?
Here’s the reality check most solar enthusiasts need: dirty panels typically cost you between 2-25% of your potential power output. That’s a pretty wide range, and here’s why it matters where you live and what time of year it is.
If you’re in a dusty area like Arizona or Nevada during the dry season, you might be looking at the higher end of that spectrum—sometimes even hitting 20-25% losses after just a few months without rain. Meanwhile, if you’re in the Pacific Northwest where it rains regularly, you might only see 2-5% reduction because Mother Nature is basically doing your cleaning for you.
Let me put this in practical terms. Say you’ve got a modest 3kW DIY system on your garage. At 15% soiling loss, you’re losing about 450 watts of generating capacity. Over a sunny day, that could translate to 2-3 kWh of energy you paid for but aren’t using—roughly what it takes to run your refrigerator for a day.
I learned this the hard way last summer when I noticed my morning coffee routine (yes, I track my solar output while drinking coffee) showed consistently lower numbers. After a quick cleaning, my panels bounced back by 18%. That’s real power you can actually use.
The good news? Once you establish your baseline through simple testing, you’ll know exactly when cleaning makes financial sense for your specific situation.
Signs Your Panels Need Attention
Learning to spot when your solar panels need cleaning is easier than you might think, and it’s something I learned the hard way during my first year with solar. I remember staring at my monitoring app, confused why my output had dropped, only to climb up and discover a layer of pollen so thick I could write my name in it!
Let’s start with the obvious signs. Walk around your property and look up at your panels from different angles. Visible dirt, dust layers, or bird droppings are clear indicators that it’s time for a cleaning session. Bird droppings are particularly problematic because they’re not just unsightly—they create concentrated shadows that can significantly reduce output from affected cells. If you see white streaks or splotches, prioritize cleaning soon.
Pollen during spring months can create a yellowish film that’s sometimes hard to spot from ground level. Try taking photos with your phone camera and zooming in—you’ll be surprised what the camera picks up that your naked eye might miss.
Now for the subtle indicators, which are actually more important to track. Check your monitoring system or inverter display regularly. A gradual decline in output over several weeks, even on sunny days, often points to soiling buildup. I recommend keeping a simple spreadsheet where you note peak output on clear days. If you see a 5-10% drop compared to your baseline from a month ago, and weather conditions are similar, soiling is likely the culprit.
Here’s what normal versus problematic looks like: A light dust layer that doesn’t block the panel surface texture is usually fine—rain will handle it. But when you can’t clearly see the grid lines of the solar cells anymore, or when dirt has created a noticeable film, that’s your action threshold.
One practical tip: take reference photos when your panels are freshly cleaned. Compare new photos monthly against your clean baseline. This visual comparison method has helped countless DIYers in our community catch soiling issues before they significantly impact production.
DIY Testing Methods That Actually Work
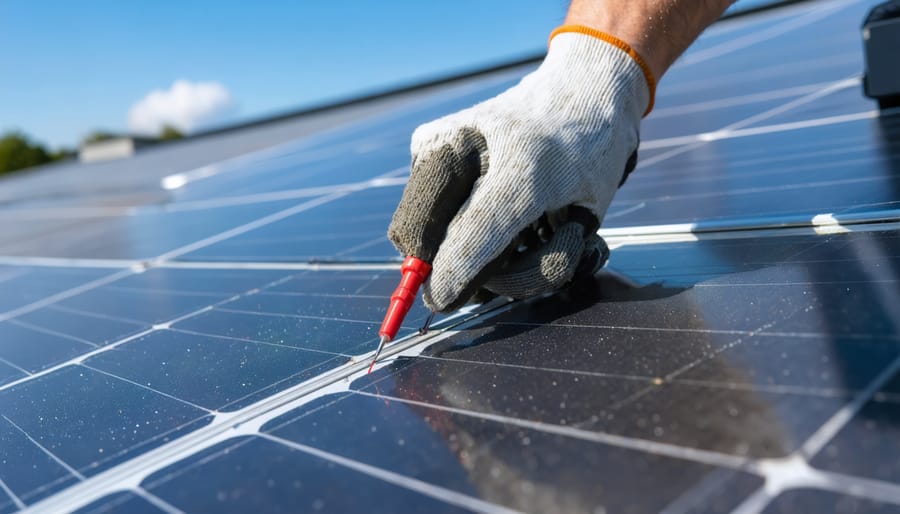
Simple testing equipment like a multimeter allows DIY solar owners to measure and compare output between clean and dirty panels.
The Simple Clean vs. Dirty Panel Test
Here’s a simple experiment I love recommending to folks who want real proof about how dirt affects their panels. Last summer, I tried this with my neighbor Charles, and the results surprised even him—his supposedly “clean enough” panels were losing 18% of their output!
Start by selecting two identical panels with similar sun exposure. If you only have one array, you can test half your panels cleaned versus half dirty, just make sure they’re getting the same sunlight conditions. You’ll need either a basic multimeter or access to your charge controller’s display. If you don’t have a multimeter, don’t worry—you can test without a multimeter using smartphone apps or charge controller data.
On a clear, sunny day around noon, measure the voltage and amperage from your dirty panel. Write these numbers down. Most charge controllers show this real-time data, making testing solar panels incredibly straightforward. If using a multimeter, connect the red probe to positive and black to negative, measuring voltage first, then switch to amperage mode.
Now thoroughly clean one panel with water and a soft brush. Wait 15 minutes for it to dry completely, then measure again under the same sun conditions. Calculate the power output for both panels by multiplying voltage times amperage (V x A = Watts).
Compare the numbers. A difference of 5% or less means your panels are reasonably clean. Between 5-15% suggests regular cleaning would help. Anything over 15%, like Charles discovered, means you’re leaving serious energy on the table. This simple test gives you concrete data about whether cleaning makes financial sense for your specific situation and environment.
Tracking Performance Over Time
Creating a simple tracking system is easier than you might think, and it’s one of the best ways to catch soiling issues before they seriously impact your energy production. I started with just a basic spreadsheet where I logged my system’s daily output every evening—it took about two minutes and gave me incredibly valuable insights over time.
Start by recording your daily or weekly kilowatt-hour production in a simple log. Include the date, total output, and any weather notes like “cloudy morning” or “heavy dust storm yesterday.” This creates your baseline pattern. After a few weeks, you’ll notice your system’s rhythm and can spot when something’s off.
Here’s where it gets useful: normalize your data for weather and seasons. If your panels produced 25 kWh on a sunny summer day versus 15 kWh on a similar day two months later, that difference might indicate soiling rather than seasonal change. Compare similar weather days month-to-month to isolate the dirt factor.
Several free tools make this effortless. Apps like Solar Analytics and Sense offer tracking features, while many inverter manufacturers provide built-in monitoring solutions through their platforms. For spreadsheet lovers, Google Sheets templates designed for solar tracking are available free online—just search “solar production tracker template.”
The key is consistency. Even rough tracking reveals patterns that help you decide when cleaning makes economic sense versus waiting another week.
The Dollar Store Solution to Soiling Monitoring
Here’s my favorite trick that won’t break the bank: create your own soiling monitoring station using a small reference panel or even just a piece of glass. I stumbled onto this approach after spending way too much money on fancy monitoring equipment that honestly didn’t tell me much more than my dollar store version.
The concept is brilliantly simple. Place a small solar panel or a clean piece of glass at the exact same angle as your main array, somewhere easily accessible. This becomes your soiling indicator. When I set mine up, I used an old 10-watt panel I had lying around from a previous project, mounted it right next to my garden shed where I could reach it without climbing on the roof.
Here’s how it works in practice: every week or two, clean your reference panel completely and measure its output or simply photograph it next to a clean piece of glass for visual comparison. As dirt accumulates over the following days, you’ll see exactly what’s happening on your main array. The reference panel gets dirty at the same rate as your roof-mounted panels, giving you a perfect real-world indicator.
You can take this further by creating multiple reference samples. Keep one pristine clean and compare it against your weathered sample. The visual difference is striking and helps you decide when cleaning is actually worth your time. Some DIYers even mark their reference glass with a grid using a permanent marker, making it easier to photograph and track soiling patterns over time.
Setting Up a Monitoring Routine That Fits Your Life
What to Check and When
Creating a monitoring routine doesn’t have to be complicated. I check my panels every two weeks, and honestly, it’s become part of my weekend ritual with my morning coffee. Here’s what works for me and the DIY community I’ve connected with over the years.
Start with a visual walk-around. Look for obvious dirt, bird droppings, or debris from about 10 feet away. Then check your solar power meters or monitoring app to note your current output numbers. Compare these readings to your baseline performance from when the panels were clean.
Pay attention to weather patterns in your area. After windstorms or long dry spells, you’ll likely see more buildup. One neighbor in Arizona told me she checks weekly during dust storm season but monthly in winter.
Consider seasonal factors too. Spring brings pollen that creates a sticky film. Summer dust clings to hot panels. Fall means leaves and organic debris. Winter might bring less soiling overall, but snow residue can leave mineral deposits.
Keep a simple log, even just photos on your phone with dates. This helps you spot patterns and decide when cleaning is actually necessary versus just nice to have.
Documenting Your Findings
Creating a simple documentation system makes a huge difference in understanding your panels’ performance over time. Start by taking consistent photos from the same angle and distance every time you inspect your array—I learned this the hard way when Charles pointed out my random snapshots were basically useless for comparison. Use your phone’s camera with a timestamp enabled, and snap pictures of individual panels showing any visible dirt, bird droppings, or debris.
Record your voltage and current measurements in a spreadsheet or notebook, along with the exact time of day and weather conditions. Note whether it’s sunny, partly cloudy, or hazy, and check your local air quality index. These environmental factors directly impact soiling rates. Don’t forget to measure the tilt angle of your panels if you haven’t already—dust accumulates differently on flat versus angled surfaces.
After a few weeks of consistent logging, patterns emerge. You’ll notice if pollen season hammers your output or if nearby construction kicks up extra dust. This data helps you interpret the results and establish a cleaning schedule that makes sense for your specific location. Instead of cleaning randomly, you’ll know exactly when performance drops warrant action, saving time and water while maximizing energy production.
Regular documentation through photos and notes helps solar owners track soiling patterns and optimize their cleaning schedules throughout the year.
When to Clean (And When to Wait)
Here’s the tricky part I learned the hard way: knowing when cleaning is actually worth your time. Last summer, I was religiously cleaning my panels every two weeks until I realized I was only gaining back about 2-3% efficiency while spending an hour each session. That’s when I developed what I call my “5% rule.”
If your monitoring shows less than 5% power loss compared to your clean baseline, hold off on cleaning. The effort and potential risk usually aren’t worth the minimal gains. Once you hit that 5-10% loss threshold, it’s time to take action. Beyond 15% loss, you’re leaving significant energy on the table.
Your cleaning schedule should really depend on your local environment. Living near agricultural areas or dusty regions? You might need monthly cleanings during peak seasons. In suburban areas with regular rain, you could go three to six months between cleanings. I keep a simple log in my phone noting cleaning dates and the immediate performance boost afterward, which helps me predict when the next cleaning will be worthwhile.
Now, let’s talk safety because this matters more than any efficiency gain. If your panels are roof-mounted and you’re not completely comfortable working at heights, don’t do it yourself. Period. The cost of professional cleaning every few months is far less than a hospital visit or worse. I have ground-mounted panels specifically because I wanted easy maintenance access.
For those with roof arrays, consider these alternatives: invest in a long-reach cleaning system that lets you work from the ground, hire professionals for biannual deep cleans, or install monitoring systems that definitively tell you when cleaning is necessary rather than guessing. Some folks in my local solar community have even coordinated group professional cleaning sessions to split costs.
Remember, solar panels are designed to be mostly self-cleaning through rain. If you’re in a reasonably wet climate and not seeing major losses, nature might be handling the job for you.
Proper cleaning techniques restore solar panel efficiency while maintaining safety on roof-mounted installations.
Real Stories from the DIY Solar Community
I’ve learned so much from our amazing DIY solar community over the years, and their real-world experiences with soiling have been eye-opening. Let me share some stories that might sound familiar to you.
My friend Maria in Phoenix noticed something interesting when she started tracking her panel output. Living in the desert Southwest, she expected dust to be her biggest enemy. What surprised her was the seasonal pattern. During monsoon season, her panels actually got cleaner from occasional rains, but the dry months from October through May showed dramatic soiling rates of about 0.2% loss per day. That’s nearly 6% monthly if left uncleaned. She started a simple Monday morning ritual, checking her monitoring app with her coffee, and cleaning whenever output dropped below 93%.
Meanwhile, Tom in Atlanta had the opposite problem. His humid Southeast location meant less dust but more organic buildup. Pollen in spring was his nemesis, creating a yellow film that reduced output by 8% in just two weeks. He didn’t realize the impact until he compared his production data to a neighbor’s system just three blocks away. The difference was all about cleaning schedules.
Then there’s my own testing in a suburban environment. I placed two identical small panels side by side, cleaning one monthly and leaving the other untouched for three months. The dirty panel lost 15% efficiency, mostly from urban pollution and tree sap residue. This simple experiment cost me nothing but taught me everything about local soiling patterns.
The biggest takeaway from our community? Your climate writes your cleaning schedule. Track your specific conditions for at least one season before establishing your routine.
You now have everything you need to take control of soiling loss in your solar setup. I remember when I first started monitoring my panels—I felt a bit overwhelmed by all the technical information out there. But once I broke it down into simple, manageable steps, it became second nature. The same will happen for you.
Start small. Pick one monitoring method that feels comfortable—maybe it’s just comparing daily output readings or doing the simple flashlight test we discussed. Commit to checking your panels once a month at first, then adjust your schedule based on what you discover. You might find that your specific location needs more frequent attention during pollen season, or perhaps you’re lucky enough to get regular rain that does most of the work for you.
Keep a simple log, even if it’s just notes on your phone. Patterns will emerge, and you’ll develop an intuition about when your panels need attention. Don’t aim for perfection—aim for improvement. Even a basic cleaning routine can recover 10-20% of lost energy production, which translates directly to savings and more power for your home.
I’d love to hear about your experiences. What monitoring methods worked best for you? Did you discover any unique soiling challenges in your area? Share your insights with the community—your observations might help someone else optimize their system.
Remember, every bit of energy you recover from those dusty panels is energy you’re producing yourself. That’s the beauty of solar: you’re in the driver’s seat. Now get out there and make those panels shine.
How useful was this post?
Click on a star to rate it!
Average rating 0 / 5. Vote count: 0
No votes so far! Be the first to rate this post.
We are sorry that this post was not useful for you!
Let us improve this post!
Tell us how we can improve this post?
charlesnoble
Here at Spheral Solar, I’m a hands-on solar power enthusiast, constantly exploring and experimenting with DIY solutions. I’m dedicated to sharing my discoveries, insights, and even the bumps I hit along the way, all in the pursuit of a more sustainable future.
Dirty Solar Panels Are Costing You Money (Here’s How… by Nick November 5, 2025 Clean your solar panels every 3-6 months to maintain peak efficiency—dirty panels can lose up to 25% of their energy output. Regular maintenance takes just an hour and requires minimal equipment, making it one of the most cost-effective ways to maximize your solar investment. Start by checking your system’s performance…
Why Your DIY Solar Project Needs a Calibrated… by Charlesnoble February 3, 2026 Point your infrared thermometer at your solar panel surface on a sunny afternoon, and you might get a reading of 145°F—but is that number actually accurate? Without proper calibration, that measurement could be off by 10, 20, or even 30 degrees, leading you to misdiagnose hot spots, overestimate efficiency losses,…
Your Multimeter Can Tell You Everything About Your… by Charlesnoble March 8, 2026 Grab your multimeter and set it to AC voltage mode—typically marked as “V~” or “VAC”—which allows you to measure the alternating current output from your solar inverter, the device that converts your panels’ DC power into usable household electricity. You’ll want to verify that your system is delivering the standard…
Why Your RV Solar Panels Aren’t Charging (And How to… by Charlesnoble November 30, 2025 Check your multimeter readings at each connection point along your solar charging path—from panels to charge controller to battery—to pinpoint exactly where voltage disappears. Most RV solar systems lose 10-30% of their potential power to voltage drop, but this invisible thief often goes undetected until you systematically measure and compare…
Why Your Solar Meter Numbers Don’t Match Your… by Charlesnoble January 20, 2026 Look at your solar meter display right now and locate the kWh reading—this number tells you exactly how much electricity your panels have generated since installation, and if it’s climbing daily, your system is working. Check whether your meter’s digital arrows or symbols are moving forward (you’re using solar power…
Why Your DIY Solar System Needs 3-Phase Power… by Charlesnoble December 26, 2025 Check your electrical panel right now—if you see three thick cables entering your home or property instead of two, you’re already working with 3-phase power, and standard single-phase monitoring won’t give you the complete picture of your solar system’s performance. This matters more than most DIY solar enthusiasts realize: a…
Subscribe for handpicked DIY projects, exclusive tips, and giveaways.
Measure your inverter’s efficiency by comparing DC input power to AC output power using a simple multimeter—a ratio below 95% signals it’s time to investigate performance issues. Track voltage and current readings at both the solar panel array and your home’s load center during peak sun hours, then multiply volts by amps to calculate actual… Read more: Your DIY Solar Inverter Might Be Wasting Power (Here’s How to Find Out)
Check your solar inverter’s communication ports right now – if you see two screw terminals labeled A and B (or D+ and D-), you’re looking at 2-wire RS485, the most common communication protocol in DIY solar monitoring setups. This simple two-wire system lets your solar equipment talk to monitoring devices, allowing you to track power… Read more: Why 2-Wire RS485 Is the Smartest Choice for Your DIY Solar Monitoring System
Match your solar panels to microinverters or power optimizers based on your roof’s shading patterns—even partial shade from a chimney or tree during morning hours means module-level power electronics will recover 15-25% more energy than string inverters lose to the weakest panel. Install power optimizers when you’re working with mixed panel orientations across multiple roof… Read more: Why Smart Solar Modules Could Save Your DIY Array (Before It’s Too Late)


")
")
")
")
")
")
")
")
")
")
")
")