Your DIY Solar Inverter Might Be Wasting Power (Here’s How to Find Out)
Updated:
Measure your inverter’s efficiency by comparing DC input power to AC output power using a simple multimeter—a ratio below 95% signals it’s time to investigate performance issues. Track voltage and current readings at both the solar panel array and your home’s load center during peak sun hours, then multiply volts by amps to calculate actual power conversion rates. Monitor your system’s daily energy production against the manufacturer’s specifications, accounting for shading and temperature factors that naturally reduce output by 10-20%.
Your solar inverter is the hidden workhorse of your renewable energy system, silently converting the DC electricity your panels generate into the AC power your home actually uses. Yet most DIY solar enthusiasts never verify whether this critical component is delivering its promised performance. I learned this lesson the hard way when my own system was underperforming by nearly 30% for six months before I noticed—costing me hundreds in lost energy production.
Smart inverters take this essential conversion role further by adding communication capabilities, grid support functions, and real-time monitoring that transforms your solar setup from a passive power generator into an intelligent energy management system. These advanced devices can adjust voltage, respond to grid conditions, and provide detailed performance data through smartphone apps or web interfaces.
But here’s what matters most: even the smartest inverter won’t help your system if it’s not operating efficiently. Whether you’re troubleshooting existing equipment, planning a new installation, or simply want to maximize your solar investment, understanding how to test inverter efficiency gives you control over your energy production. You don’t need expensive equipment or an engineering degree—just a methodical approach, basic tools, and the willingness to get hands-on with your system.
What Makes an Inverter ‘Smart’ (And Why It Matters for Your DIY Setup)
Modern smart inverters feature built-in monitoring capabilities and advanced grid-support functions that traditional inverters lack.
The Real-World Difference Between Smart and Standard Inverters
Here’s the practical truth: when I first upgraded from a standard inverter to a smart one on my workshop solar setup, the difference felt like going from driving blind to having a full dashboard. Let me show you what that actually means for your DIY system.
A standard inverter does one job: it converts DC power from your panels to AC power you can use. That’s it. You get some basic LED indicators showing it’s working, maybe an error light if something goes wrong, but otherwise you’re in the dark about what’s happening inside your system. It’s like having a car with no speedometer, fuel gauge, or temperature reading.
Smart inverters do that same conversion job, but they also become your system’s information hub. They monitor voltage levels, track energy production hour by hour, measure efficiency in real-time, and send all that data to your phone or computer. When I noticed my morning production dropping last spring, my smart inverter’s app immediately showed me the voltage curve was off. Turned out some leaves had piled up on my panels overnight. With my old inverter, I would have noticed weeks later when checking my utility bill.
The control aspect is equally important. Smart inverters let you adjust settings remotely, set performance alerts, and even throttle output if needed for grid compliance. For testing efficiency, this is crucial because you can actually see your conversion percentage changing throughout the day, compare it against manufacturer specs, and identify problems before they become expensive failures.
Standard inverters might cost fifty to a hundred dollars less, but you’re essentially buying equipment without diagnostic tools. For anyone serious about optimizing their DIY solar investment, that’s a false economy.
Why Your Inverter’s Efficiency Actually Matters
The Hidden Costs of Inefficient Inverters
Let me give you a real-world example from my own experience. Last summer, I upgraded my RV’s inverter from an older model to a newer smart inverter. The old one had about 85% efficiency, while the new one runs at 95%. That might sound like a small difference, but here’s where it gets interesting.
On a typical three-day camping trip, my family uses about 15 kilowatt-hours of power for our fridge, lights, phone charging, and occasional laptop use. With my old 85% efficient inverter, I was actually drawing 17.6 kWh from my battery bank to get that 15 kWh of usable power. The 2.6 kWh difference was just turning into heat. With the newer inverter at 95% efficiency, I only draw 15.8 kWh for the same usage. That saves me about 1.8 kWh per trip, which translates to needing fewer solar panels and a smaller battery bank.
For home systems, the numbers get even more significant. Consider a household using 30 kWh daily. Over a month, a 5% efficiency gap means losing about 45 kWh to heat instead of powering your home. That’s roughly the energy needed to run your refrigerator for an entire month, just vanishing into thin air. At typical electricity rates, that’s $5-7 monthly, or $60-84 annually, on a system that should last 10-15 years.
Testing Your Inverter’s Efficiency: The DIY Approach
Tools You’ll Need (Most Under $50)
Good news: you won’t need to break the bank to test your smart inverter’s efficiency. Most of the essential testing equipment and tools cost less than fifty bucks, and you probably already own some of them.
First up is a basic digital multimeter. This is your absolute must-have tool, typically running between $20-40 for a decent model. It measures voltage, current, and resistance, helping you verify what your inverter is actually producing versus what it claims. I’ve had the same $25 multimeter for three years now, and it’s been through countless projects.
Next, consider a clamp meter, which ranges from $30-50 for entry-level versions. Unlike a standard multimeter, this handy device clamps around a wire to measure current without breaking the circuit. It’s perfect for checking AC output without disconnecting anything, making your testing process much safer and faster.
A power consumption monitor, often called a Kill-A-Watt style device, typically costs $20-35. You simply plug it between your inverter and the device you’re powering. It displays real-time wattage, cumulative energy use, and even calculates costs. These solar power meters are invaluable for comparing your inverter’s input versus output over time.
Finally, grab a simple notebook or use a smartphone app to log your readings. Tracking data over days or weeks reveals patterns you’d otherwise miss and helps identify efficiency drops before they become serious problems.
Testing inverter efficiency requires basic affordable tools like digital multimeters that most DIY solar enthusiasts already own.
The Five-Minute Efficiency Test
You don’t need fancy equipment or an engineering degree to get a solid baseline reading on your inverter’s performance. I remember the first time I tested my inverter efficiency – I was convinced I needed expensive meters and complicated formulas. Turns out, a simple five-minute test gave me all the information I needed to know if my system was pulling its weight.
Here’s how to do it yourself. You’ll need just three things: a sunny day (ideally around noon when your panels are producing well), access to your inverter’s display or monitoring app, and a basic calculator.
Start by checking your inverter display for two key numbers: DC input power and AC output power. Most modern inverters show both readings right on the screen or in their app. Write these down at the same moment – this is important because solar production fluctuates constantly.
Now for the simple math. Divide your AC output by your DC input, then multiply by 100. That’s your efficiency percentage. For example, if your inverter is receiving 1000 watts of DC power from your panels and outputting 950 watts of AC power to your home, your calculation looks like this: 950 divided by 1000 equals 0.95, times 100 equals 95 percent efficiency.
So what do these numbers actually mean? A healthy inverter should operate between 94 and 98 percent efficiency under normal conditions. Anything above 93 percent is generally acceptable. If you’re seeing numbers below 90 percent, that’s your signal to investigate further – you might have connection issues, aging components, or configuration problems worth addressing. Don’t panic if your first reading seems low, though. Inverters are slightly less efficient at very low or very high power levels, so try testing at different times when production varies.
Setting Up Continuous Monitoring for Your Smart Inverter
Using Your Inverter’s Built-In Monitoring Features
Most modern smart inverters come equipped with impressive built-in monitoring capabilities, and learning to use them is like getting a window into your system’s soul. I remember the first time I accessed my inverter’s monitoring dashboard—it was both overwhelming and exciting to see all that data at my fingertips!
Most inverters offer monitoring through one of three interfaces: a small LCD display on the unit itself, a smartphone app, or a web-based portal you access through your home network. The LCD display usually shows basic real-time information, while apps and web portals provide deeper historical data and analytics. Check your inverter’s manual to see which options yours supports—many offer all three.
Here are the key metrics you’ll want to track regularly:
Daily energy production (measured in kilowatt-hours) gives you a snapshot of how much power you’re generating each day. Compare this against your baseline to spot performance drops quickly.
Efficiency percentage shows how well your inverter converts DC power from your panels into usable AC power. Most quality inverters run between 95-98% efficient.
Input voltage and current from your solar array help identify panel-related issues before they become serious problems.
Temperature readings alert you to overheating, which can reduce efficiency and lifespan.
Many monitoring solutions also track cumulative lifetime production and even estimate your carbon offset—a nice motivational bonus! Set up notifications for unusual drops in production so you can troubleshoot quickly. Once you understand these basics, you’ll feel confident managing your system’s performance.
Smart inverter monitoring apps allow DIY solar users to track system performance and efficiency in real-time from anywhere.
Adding Monitoring to Non-Smart Inverters
If you’ve got an older inverter that’s chugging along just fine but lacks those fancy monitoring features, don’t worry—you’re not stuck in the dark ages. I remember when I first started tinkering with solar, my budget inverter had zero feedback beyond a blinking green light. But here’s the good news: you can add monitoring capabilities without breaking the bank or replacing your entire system.
The simplest approach is installing a power meter between your inverter and your electrical panel. Devices like the Kill A Watt meter or similar energy monitors can track watts, voltage, and cumulative energy production. They’re affordable (usually under $30) and plug right in. I installed one on my workshop system, and suddenly I could see exactly what my panels were producing throughout the day.
For a more permanent solution, consider clamp-on current sensors combined with a basic data logger. These devices wrap around your DC or AC cables and measure current flow without any cutting or splicing. Pair them with an Arduino or Raspberry Pi, and you’ve got yourself a DIY monitoring station. There are tons of open-source projects online with step-by-step guides—the community has really embraced this approach.
Another option is standalone solar monitors like the IotaWatt or similar energy monitoring systems. These provide smartphone apps, cloud data storage, and real-time tracking for around $100-200. They’re specifically designed to work with any inverter type and can monitor multiple circuits simultaneously.
The key is starting simple. Even basic monitoring beats no monitoring, and you’ll quickly gain insights into your system’s performance patterns and efficiency.
Reading the Data: What Those Numbers Actually Tell You
Red Flags That Mean Your Inverter Needs Attention
Your smart inverter is constantly gathering data about its performance, and knowing what to look for can save you from bigger headaches down the road. Think of these warning signs as your system’s way of asking for help.
One of the clearest red flags is a sudden drop in efficiency, typically anything beyond 2-3% compared to your baseline. I remember when my neighbor Charles noticed his inverter efficiency had dipped from 96% to 89% over just two weeks. Turns out, a cooling fan had failed, causing the unit to overheat. Catching power losses early like this prevented what could have been expensive damage to the entire inverter.
Watch for inconsistent power output even when sunlight conditions remain stable. Your monitoring app should show relatively smooth curves throughout the day. If you’re seeing erratic spikes or drops that don’t match cloud cover or shade patterns, something’s off. This often points to loose connections or developing electronic issues.
Temperature readings matter too. Most inverters operate best below 140°F (60°C). If yours consistently runs hotter, check for blocked ventilation, excessive dust buildup, or confirm it’s not in direct sunlight.
Another concern is frequent error codes or system shutdowns. While occasional grid disconnections happen during utility maintenance, daily errors suggest deeper problems. Check your inverter’s manual to decode specific error messages, but common culprits include ground faults, voltage irregularities, or aging capacitors.
Finally, listen to your inverter. New buzzing, clicking, or humming sounds often indicate loose components or electrical arcing that needs immediate attention.
Optimizing Your System Based on What You Learn
Once you’ve gathered data from your efficiency testing and monitoring, the real magic happens—turning those insights into action! I remember when I first started analyzing my system’s performance data. I felt like a detective uncovering clues, and each discovery led to a tweak that made everything run smoother.
Start with load balancing. Your monitoring data will reveal when your system is most strained. If you notice your inverter efficiency drops during peak usage times, consider spreading out your high-draw appliances throughout the day. For example, run your washing machine in the morning when solar production is ramping up, and save the dishwasher for early afternoon when your panels are generating maximum power. This simple shift can keep your inverter operating in its sweet spot efficiency range.
Next, examine timing patterns. Your smart inverter data might show that running multiple heavy loads simultaneously causes the system to work harder and less efficiently. I learned this the hard way when running my power tools and air compressor at the same time—my efficiency dropped by nearly 15 percent! Now I stagger those tasks, and my system purrs along happily.
Don’t overlook small system tweaks either. If your monitoring reveals consistent voltage fluctuations, check your wire connections and consider upgrading to heavier gauge cables for high-current runs. Temperature data can prompt you to improve ventilation around your inverter, sometimes boosting efficiency by several percentage points.
Finally, use your findings to set realistic expectations. Maybe your system performs best between 20 and 80 percent load capacity. Knowing this helps you plan future expansion or battery additions more strategically. Remember, optimization is an ongoing journey, not a one-time fix. Keep testing, keep learning, and watch your system’s performance improve over time.
Properly optimized DIY solar systems maximize power generation efficiency, especially critical for RV and off-grid applications.
Understanding your inverter’s efficiency isn’t just about numbers on a screen—it’s about taking control of your solar investment and making informed decisions that benefit both your wallet and the environment. Throughout this guide, we’ve explored how smart inverters work, why efficiency matters, and practical ways to test and monitor performance without needing an engineering degree or expensive equipment.
I remember when I first started testing my own system. I was intimidated by all the technical talk, but once I realized that monitoring could be as simple as checking my inverter’s display and doing some basic math, everything clicked. You don’t need to dive into complex analytics on day one. Start with the straightforward power comparison test we covered—measure what’s coming from your panels and what’s leaving your inverter. That single number will tell you so much about your system’s health.
The beauty of modern smart inverters is that they’re designed with users like us in mind. The data is already there, waiting for you to access it. Whether you’re troubleshooting a problem or simply curious about optimization, you now have the tools and knowledge to begin.
Ready to take the next step? Head over to Spheral Solar’s efficiency calculators to crunch your numbers, or join our community forum where DIYers share their testing results, troubleshooting tips, and success stories. Your solar journey is uniquely yours, but you don’t have to navigate it alone.
How useful was this post?
Click on a star to rate it!
Average rating 0 / 5. Vote count: 0
No votes so far! Be the first to rate this post.
We are sorry that this post was not useful for you!
Let us improve this post!
Tell us how we can improve this post?
charlesnoble
Here at Spheral Solar, I’m a hands-on solar power enthusiast, constantly exploring and experimenting with DIY solutions. I’m dedicated to sharing my discoveries, insights, and even the bumps I hit along the way, all in the pursuit of a more sustainable future.
Your Multimeter Can Tell You Everything About Your… by Charlesnoble March 8, 2026 Grab your multimeter and set it to AC voltage mode—typically marked as “V~” or “VAC”—which allows you to measure the alternating current output from your solar inverter, the device that converts your panels’ DC power into usable household electricity. You’ll want to verify that your system is delivering the standard…
Why Your Solar Meter Numbers Don’t Match Your… by Charlesnoble January 20, 2026 Look at your solar meter display right now and locate the kWh reading—this number tells you exactly how much electricity your panels have generated since installation, and if it’s climbing daily, your system is working. Check whether your meter’s digital arrows or symbols are moving forward (you’re using solar power…
Why Your DIY Solar Project Needs a Calibrated… by Charlesnoble February 3, 2026 Point your infrared thermometer at your solar panel surface on a sunny afternoon, and you might get a reading of 145°F—but is that number actually accurate? Without proper calibration, that measurement could be off by 10, 20, or even 30 degrees, leading you to misdiagnose hot spots, overestimate efficiency losses,…
Why Your RV Solar Panels Aren’t Charging (And How to… by Charlesnoble November 30, 2025 Check your multimeter readings at each connection point along your solar charging path—from panels to charge controller to battery—to pinpoint exactly where voltage disappears. Most RV solar systems lose 10-30% of their potential power to voltage drop, but this invisible thief often goes undetected until you systematically measure and compare…
Never Worry About Your DIY Solar System Again With… by Charlesnoble October 30, 2025 Monitor your DIY solar system’s performance from anywhere using dedicated hardware monitors, smartphone-connected inverters, or cloud-based platforms that track voltage, current, and energy production in real-time. Install a basic Bluetooth-enabled shunt monitor for under $50 to see exactly how many watts your panels generate and how much power your batteries…
Read Your Solar System Like a Pro: What Every Wire… by Charlesnoble October 31, 2025 Locate the single-line diagram in your solar system documentation—it’s your roadmap to understanding how energy flows from panels through inverters to your home’s electrical panel. This schematic shows every critical component: charge controllers, battery banks, breaker boxes, and safety disconnects, all connected by lines representing wire runs with their corresponding…
Subscribe for handpicked DIY projects, exclusive tips, and giveaways.
Measure your inverter’s efficiency by comparing DC input power to AC output power using a simple multimeter—a ratio below 95% signals it’s time to investigate performance issues. Track voltage and current readings at both the solar panel array and your home’s load center during peak sun hours, then multiply volts by amps to calculate actual… Read more: Your DIY Solar Inverter Might Be Wasting Power (Here’s How to Find Out)
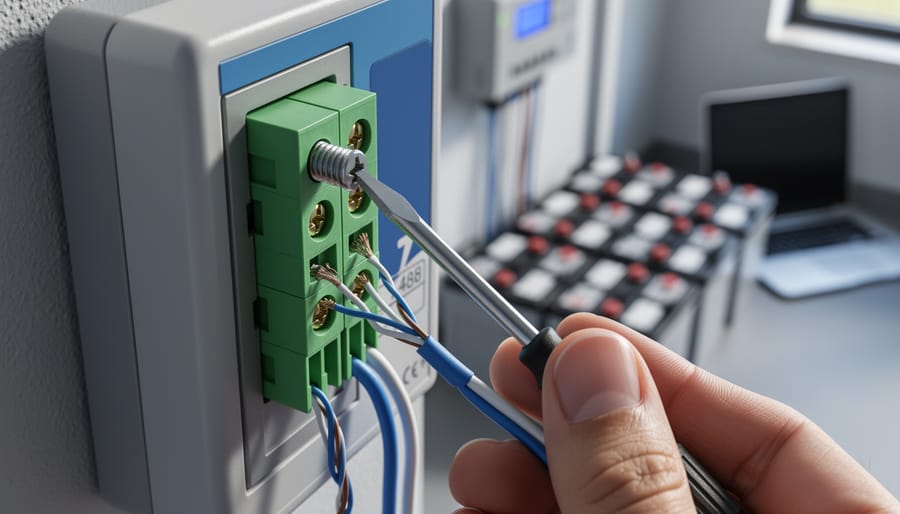
Check your solar inverter’s communication ports right now – if you see two screw terminals labeled A and B (or D+ and D-), you’re looking at 2-wire RS485, the most common communication protocol in DIY solar monitoring setups. This simple two-wire system lets your solar equipment talk to monitoring devices, allowing you to track power… Read more: Why 2-Wire RS485 Is the Smartest Choice for Your DIY Solar Monitoring System
Match your solar panels to microinverters or power optimizers based on your roof’s shading patterns—even partial shade from a chimney or tree during morning hours means module-level power electronics will recover 15-25% more energy than string inverters lose to the weakest panel. Install power optimizers when you’re working with mixed panel orientations across multiple roof… Read more: Why Smart Solar Modules Could Save Your DIY Array (Before It’s Too Late)


")
")
")
")


")
")
")
")