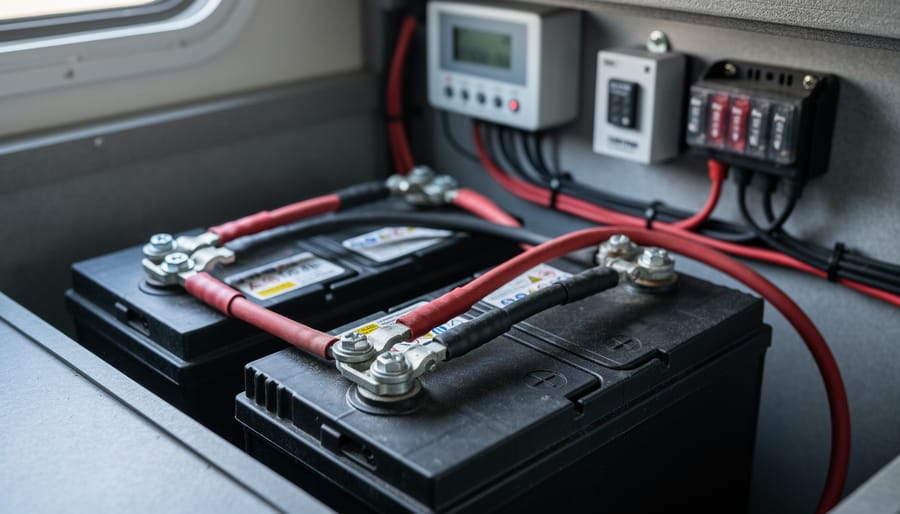
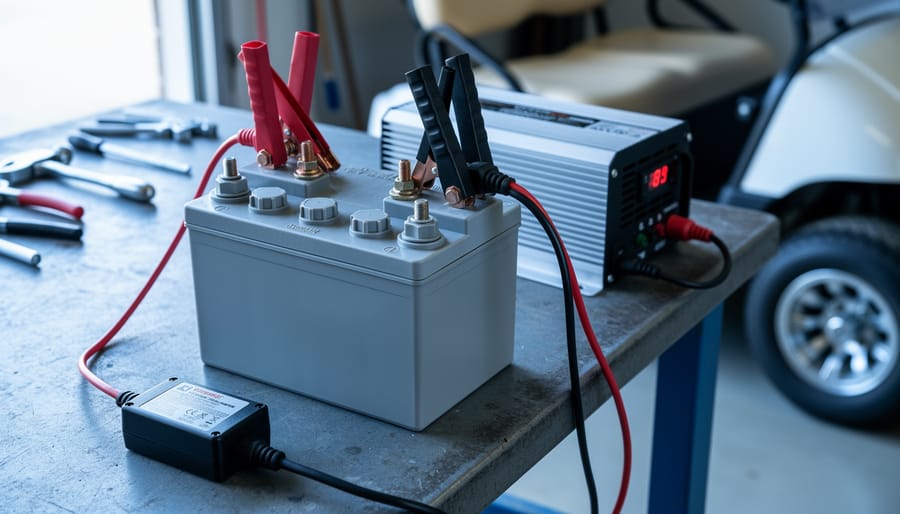
A lead acid battery voltage chart gives you a quick way to estimate your battery’s current charge level. Measure the battery voltage, check the chart, and you’ll have a reasonable idea of how much capacity remains.
Keep in mind that different types of lead acid batteries operate at different voltage ranges. Flooded, AGM, and gel batteries each have their own characteristics, so voltage charts offer a general indication rather than a precise measurement of battery state of charge.
In this guide, we’ll walk through lead acid battery voltage charts and show you how to read them accurately. You’ll learn how voltage relates to state of charge, the proper way to measure open circuit voltage, and why factors like temperature and current draw affect your readings.
Let’s get started.
How Battery Voltage And State of Charge Are Related
Before we dive into the specific voltage charts, it’s important to understand the general relationship between voltage and capacity in lead acid batteries:
As a lead acid battery discharges, the voltage decreases linearly. For example, a 12V battery may provide 12.6V when fully charged. After discharging halfway, the voltage will drop to around 12.3V.
The rate of discharge impacts the voltage. Faster discharge rates result in lower voltages for a given state of charge.
Higher lead acid battery voltages indicate higher states of charge. For instance, 12.6V means a 12V battery is fully charged, while 12.0V means it’s around 50% capacity.
Temperature affects voltage, too. Cold temperatures increase the voltage while hot temps decrease it. The charts here assume room temperature.
Considering these principles, let’s look at some typical lead acid battery voltage charts.
SOC vs Battery Voltage Charts for 6V, 12V, 24V, and 48V Lead Acid Batteries
Battery voltage charts for lead acid batteries vary slightly depending on the specific battery type and construction.
Below are voltage charts for both flooded lead acid and VRLA batteries (valve-regulated lead acid). These charts apply across common system voltages: 6V, 12V, 24V, and 48V configurations. While flooded lead acid cells require periodic maintenance and water top-ups, VRLA batteries are sealed and maintenance-free, though both share similar voltage-to-SOC characteristics.
6V Lead Acid Battery Voltage Charts
Six-volt lead acid batteries are common in golf carts, RV house banks, and marine applications where multiple units are wired in series to achieve higher system voltages. Understanding the 6v battery voltage at different charge states helps you maintain these batteries properly and avoid the damage caused by over-discharge or improper charging. The voltage chart below shows what you should expect from a healthy 6V battery at rest.
State of Charge (%)
6V Flooded Lead Acid (V)
6V VRLA/AGM/Gel (V)
100%
6.32
6.30
90%
6.22
6.21
80%
6.14
6.14
70%
6.08
6.08
60%
6.03
6.03
50%
5.98
5.98
40%
5.92
5.93
30%
5.86
5.87
20%
5.78
5.80
10%
5.68
5.71
0%
5.52
5.58
This 6 volt battery chart provides resting voltage readings, meaning the battery should sit disconnected from any load or charger for at least 3 hours before measurement. Voltage under load will drop significantly, and voltage immediately after charging will read artificially high. For accurate state-of-charge assessment, always measure at rest.
Flooded and VRLA (valve-regulated lead acid) batteries show slightly different voltage characteristics, particularly at full charge and near depletion. Flooded cells typically reach a slightly higher fully-charged voltage due to their chemistry and charging profile. Both types benefit from a quality solar charge controller when used in off-grid systems, and pairing them with a battery capacity calculator helps you size your system correctly and avoid chronic undercharging.
12V Lead Acid Battery Voltage Charts
A 12v battery voltage chart is essential for accurately monitoring your battery bank’s health. The table below shows the relationship between open-circuit voltage and state of charge for both flooded and VRLA (sealed) 12V batteries.
State of Charge (%)
Flooded Battery Voltage (12V)
VRLA/AGM/Gel Voltage (12V)
100%
12.70V
12.85V
90%
12.58V
12.70V
80%
12.45V
12.60V
70%
12.32V
12.50V
60%
12.20V
12.35V
50%
12.06V
12.20V
40%
11.90V
12.05V
30%
11.75V
11.90V
20%
11.58V
11.75V
10%
11.31V
11.58V
0%
10.50V
10.50V
These voltage readings must be taken at rest, meaning the battery shouldn’t have been charged or discharged for at least 3 hours. Temperature also affects voltage readings. The values above assume a battery temperature around 25°C (77°F).
For accurate 12 volt battery state of charge monitoring, measure voltage before connecting loads or chargers. A battery under load will show lower voltage than its true state of charge, while a battery fresh off the charger will read artificially high.
Most solar charge controllers are programmed with voltage setpoints based on these standard charts. You can use our battery capacity calculator to determine how long your battery will last at various discharge levels.
Keep in mind that VRLA batteries (including AGM and gel types) typically rest at slightly higher voltages than flooded batteries at the same state of charge. This difference matters when setting low-voltage disconnect points or programming charge controllers.
24V Lead Acid Battery Voltage Charts
Understanding the relationship between voltage and state of charge is essential for proper 24V lead acid battery management. A reliable 24 volt battery chart helps you monitor battery health and avoid damaging deep discharges.
The table below shows typical voltage readings at different charge states for 24V systems (twelve 2V cells in series). These values apply to batteries at rest, meaning no load connected and at least 3 hours after charging or discharging.
State of Charge
24V Flooded Lead Acid
24V VRLA (AGM/Gel)
100%
25.8V – 26.4V
25.8V – 26.1V
90%
25.5V
25.4V
80%
25.2V
25.1V
70%
24.9V
24.8V
60%
24.6V
24.5V
50%
24.3V
24.2V
40%
24.0V
23.9V
30%
23.7V
23.6V
20%
23.4V
23.3V
10%
23.1V
23.0V
0%
22.8V or below
22.7V or below
Keep in mind that 24v battery voltage readings can vary slightly between manufacturers and battery designs. Temperature also affects these values: cold batteries read lower, while warm batteries read higher than the voltages shown above.
For accurate state-of-charge assessment, always measure voltage after the battery has rested. Voltage under load drops significantly and doesn’t reflect true charge level. Similarly, voltage immediately after charging appears artificially high due to surface charge.
Most deep-cycle applications should avoid discharging below 50% state of charge (24.2-24.3V) to maximize battery lifespan. Pairing your voltage monitoring with a battery capacity calculator helps you size your system correctly and avoid regular deep discharges.
If you’re using solar charging, make sure your charge controller voltage setpoints match your battery type. Quality charge controllers designed for lead acid systems will have appropriate bulk, absorption, and float voltage settings for 24V configurations. You can find more guidance in our article on the best solar charge controllers.
48V Lead Acid Battery Voltage Charts
These charts provide voltage guidelines for determining the state of charge of common flooded and sealed lead acid batteries at various voltages.
Remember to use the voltage values that match your particular battery type. And keep in mind these assume an open circuit reading at room temperature.
How to Read A Lead Acid Battery Voltage Chart?
Let’s walk through a sample voltage chart to understand exactly how to read it:
This shows a chart for a common 12V flooded lead acid battery.
The left column shows the battery’s state of charge or battery capacity remaining, in 10% increments.
The right column provides the open circuit voltage you can expect to measure at each state of charge level.
For example, when this 12V battery measures 12.29V, that indicates approximately 70% capacity remaining. If it drops to 11.63V, it is around 10% charged.
These voltage values assume the battery is at rest with no load or charging. The values may differ somewhat under load or charge. But this chart provides a handy guide for translating voltage to capacity.
Charts for different lead acid battery voltages follow the same format. Just multiply the voltages by 2 for 24V or 4 for 48V batteries.
Measuring Open Circuit Voltage
The only way to get an accurate reading of a lead acid battery’s state of charge from voltage is to measure its open circuit voltage. This means the battery must be disconnected from all loads and chargers and allowed to rest for several hours until its voltage stabilizes.
Charging or discharging a battery causes its voltage to fluctuate, sometimes quite drastically. So if you simply check voltage while the battery is wired up and in use, the reading won’t tell you much about the actual state of charge.
Once the battery is disconnected and the voltage has stabilized after a few hours, use a multimeter to measure across the positive and negative terminals. This resting open circuit voltage can then be compared to a battery voltage chart to estimate the state of charge.
When measuring open circuit voltage, the voltage alone gives a good ballpark estimate of the battery’s state of charge. However, current flow and temperature can also impact voltage. Let’s look at how these parameters impact the measured voltage.
The Impact of Current on Voltage
We know that to measure battery voltage, the battery must be at rest with no loads or charging current flowing. But what happens to the voltage when the current does flow?
When a lead acid battery discharges, the voltage decreases. The higher the discharge current, the greater the voltage drop under load. A battery supplying 50 amps will show a significantly lower terminal voltage than the same battery delivering just 5 amps, even though both are at the same state of charge.
On the other hand, when the battery is being recharged, the voltage increases. The higher the charge current, the greater the voltage rise.
This is due to the battery’s internal resistance. As current flows through the battery internal resistance, it causes a voltage drop or rise. This voltage-current relationship follows Ohm’s Law. Battery internal resistance typically ranges from 10 to 30 milliohms for a new 12V flooded lead acid battery, though this value increases with age and sulfation.
So if you measure battery voltage while charging or discharging, the reading will be higher or lower than the open circuit voltage, depending on the rate of current flow. This means resting open circuit voltage gives the most accurate correlation to the state of charge.
The Impact of Temperature on Voltage
Battery voltage is also affected by temperature. In cold conditions, lead acid batteries exhibit higher open circuit voltages. In hot temperatures, the voltages are lower.
The ideal temperature range for voltage state of charge measurements is 60°F to 80°F (15°C to 26°C). The voltage charts we listed earlier will be the most accurate in this range.
In cold weather, below 60°F (15°C), the open circuit voltages for a given state of charge will read 0.1 to 0.2 volts higher than the room temperature values.
In hot weather, above 80°F (26°C), the open circuit voltages will read 0.1 to 0.2 volts lower.
Always factor temperature in when estimating the state of charge from the battery voltage. Adjust your voltage readings up or down if the temperature is outside the ideal 60-80°F range.
Charging Voltage Requirements for Lead Acid Batteries
When charging lead acid batteries, proper voltage levels are critical. Here are some key charging voltage requirements to be aware of:
Apply a charging voltage of 2.30V to 2.45V per cell, depending on the battery type. Gel and AGM batteries need voltages at the higher end.
Reduce the voltage by 3mV per cell for every 1°C above 25°C. Increase by 3mV per cell for every 1°C below 25°C.
Finish the charge with a lower float voltage around 2.25V to 2.30V per cell. This maintains the full charge and compensates for self-discharge.
For wet cell batteries, carefully monitor the voltage at the end of charging. Stop charging if the voltage remains at 2.4V per cell for an extended period to prevent overcharging.
Refer to your battery specifications for the optimal charging voltages. Staying within the recommended ranges will maximize the performance and life of your lead acid batteries.
Charging Methods for Lead Acid Batteries
Several battery charging methods are used for lead acid batteries, each with distinct characteristics:
Constant Voltage – Charges at a set voltage level, typically around 2.45V per cell. The current drops off towards the end as the battery reaches full capacity.
Constant Current – Charges at a set current level. Reliable but requires monitoring voltage to prevent overcharging.
Multistage – Uses different voltages and currents at various stages to speed up charging while preventing overcharging. This approach delivers faster, safer results than single-stage methods.
Float – Keeps the battery at a lower 2.25V to 2.30V per cell to maintain full charge. Compensates for self-discharge.
Most modern lead acid battery chargers use a multistage approach with bulk, absorption, and float phases. This combination provides the fastest charging times without compromising safety or battery health. Quality solar charge controllers implement these sophisticated charging profiles automatically.
Always follow your battery and charger manufacturers’ recommendations for optimal charging methods and voltages. Proper charging is essential to maximizing the performance and lifespan of your lead acid batteries. Selecting the right charging method based on your battery capacity and application ensures you get the most from your investment.
Using Lead Acid Batteries with Solar Power Systems
Given their affordability, lead acid batteries remain popular for solar energy storage. Here are some tips for using lead acid solar batteries with solar power systems:
Use battery voltage charts to check the state of charge periodically. Ensure batteries aren’t undercharged or overcharged.
Choose deep-cycle batteries designed for solar rather than starter batteries. Opt for sealed VRLA batteries for reduced maintenance.
Keep batteries cool and prevent freezing. Battery life decreases rapidly above 30°C.
Limit the depth of discharge to 50% or less for the greatest longevity. Charge from PV regularly.
Use a charge controller with temperature compensation and multi-stage charging capabilities.
With proper battery selection, installation, and maintenance, lead acid batteries can provide many years of reliable solar battery storage. Just be sure to follow the voltage guidelines and recommendations provided by reputable manufacturers.
Frequently Asked Questions
What Is a Healthy Voltage for a 12V Lead Acid Battery?
A healthy battery voltage for a fully charged 12V lead acid battery at rest sits around 12.6V to 12.8V, signaling full capacity. This resting voltage is measured after the battery has been disconnected from charging for several hours, allowing surface charge to dissipate.
At 11.8V, most lead acid batteries are considered fully discharged and should be recharged promptly to avoid sulfation damage. Keep in mind that 12v battery voltage readings fluctuate under load and during charging. A battery showing 12.6V at rest might drop to 11.5V or lower when powering an inverter, then climb above 14V when connected to a solar charge controller.
How Can I Tell if My Lead Acid Battery Is Bad?
Several clear bad battery signs point to a failing lead acid battery. Consistently low voltages even after charging, an inability to hold a charge for more than a few hours, visible corrosive buildup around terminals, bulging or cracked cases, and low specific gravity readings (below 1.200 for flooded batteries) all indicate battery failure. If you notice swelling, leaking electrolyte, or the battery getting unusually hot during charging, replacement is necessary. A battery that can’t sustain load voltage above 10.5V under normal draw has likely reached the end of its service life.
Why Does Lead Acid Battery Voltage Drop Under Load?
The internal resistance of the battery causes voltage drops under load. The greater the load, the larger the voltage drop will be.
This is normal, but very large voltage drops under load may indicate worn-out batteries.
What Should the Charging Voltage Be for a 48V Lead Acid Bank?
The optimal charging voltage for 48V flooded lead acid batteries is typically around 58V to 62V at the start of charging.
Sealed batteries may need slightly higher voltages. Refer to the battery specifications.
How Can I Revive a Dead Lead Acid Battery?
If you’re trying to revive a dead battery, start with a slow charge at a low voltage of around 2.1V per cell. This gentle approach can sometimes restore capacity in deeply discharged cells without causing further damage. Monitor the voltage during charging. If it won’t hold above 10V per 12V battery after several hours, or if you measure specific gravity below 1.1 with a hydrometer, the battery has likely suffered irreversible sulfation or internal damage. At that point, replacement is your best option rather than investing more time in revival attempts.
How useful was this post?
Click on a star to rate it!
Average rating 5 / 5. Vote count: 2
No votes so far! Be the first to rate this post.
We are sorry that this post was not useful for you!
Let us improve this post!
Tell us how we can improve this post?
charlesnoble
Here at Spheral Solar, I’m a hands-on solar power enthusiast, constantly exploring and experimenting with DIY solutions. I’m dedicated to sharing my discoveries, insights, and even the bumps I hit along the way, all in the pursuit of a more sustainable future.
Do AGM Batteries Need to Be Vented? by Charlesnoble October 27, 2023 Yes, AGM batteries do need to be vented. Even though they produce relatively less hydrogen gas compared to conventional batteries, AGM batteries can still release hydrogen gas in certain overcharge conditions. Ventilation provides a safety release for these gases. This comprehensive guide will cover all you need to know about…
Lifepo4 Voltage Chart: Understanding Battery… by Charlesnoble October 18, 2023 A LiFePO4 battery voltage chart displays how the voltage is related to the battery’s state of charge. These charts vary depending on the size of the battery—whether it’s 3.2V, 12V, 24V, or 48V. This article will dive deep into interpreting these charts and their practical implications. We’ll also cover the…
Why 6 Volt Batteries Might Be Your Solar System’s… by Charlesnoble February 20, 2026 Connect 6-volt batteries in series pairs to create 12-volt banks that deliver superior amp-hour capacity and longer lifespan than single 12-volt alternatives. This wiring configuration doubles your voltage while maintaining the individual battery capacity, giving you more usable power for off-grid applications. Most RV and camping solar setups benefit from…
Which Solar Battery Actually Lives Up to the Hype? by Charlesnoble November 8, 2025 Compare capacity ratings in amp-hours (Ah) and watt-hours (Wh) first—these numbers tell you exactly how much energy each battery stores and how long it’ll power your devices. Check the depth of discharge (DoD) percentage next, because a battery with 90% DoD gives you far more usable energy than one limited…
Why Your RV Solar System Isn’t Charging (And How to Fix It) by Charlesnoble May 6, 2026 Picture this: You’re parked at a stunning boondocking spot, miles from the nearest electrical hookup, and your RV batteries are draining fast. Your fridge starts warming, lights dim, and you’re left wondering if you’ll need to pack up and find a campground. I’ve been there, and it’s frustrating. RV solar…
Why Your 8 Volt Battery Won’t Charge (And How to Fix… by Charlesnoble February 25, 2026 Match your charger voltage to your battery’s 8-volt requirement, or risk permanent damage to your battery bank. Most standard chargers output 6V or 12V, making them incompatible with the less common 8V configuration found in certain golf carts, floor scrubbers, and older solar setups. Use a dedicated 8-volt charger with…
Subscribe for handpicked DIY projects, exclusive tips, and giveaways.
Keeping your JD solar sensor light functioning at peak performance requires three simple maintenance steps: regular cleaning of the solar panel and sensor, seasonal battery checks, and proper winter storage. Most owners can complete a full maintenance cycle in under 15 minutes using household supplies, and doing so twice a year will typically extend your… Read more: How to Maintain and Care for Your JD Solar Sensor Light (Step-by-Step)
After testing a range of portable power stations with real RV loads, we found the EcoFlow DELTA 2 delivers the best overall balance of capacity, runtime, and portability for most RV owners. It ran our fridge, lights, and roof vent fan through a full overnight stretch with headroom to spare. For extended off-grid trips, the… Read more: 7 Best Portable Power Stations for RV in 2026, Tested