Make Your Solar Panels Work Harder: Real kWh Output Secrets
Updated:
Calculate your solar panel’s daily kilowatt-hour (kWh) output by multiplying its wattage rating by your location’s peak sun hours and applying a 75% efficiency factor. A typical 300-watt panel in a region with 5 peak sun hours generates approximately 1.12 kWh per day, demonstrating the real-world benefits and limitations of solar power. Understanding your actual solar production helps optimize panel placement, track system performance, and plan energy usage effectively.
Weather patterns, panel orientation, and seasonal variations significantly impact daily energy generation. While a south-facing 300-watt panel might produce 1.12 kWh during summer, expect roughly 30% less output during winter months. Modern solar installations typically combine multiple panels to achieve desired household coverage, with a 10-panel system generating between 11-15 kWh daily under optimal conditions.
For maximum energy production, position panels at your latitude angle, keep them clean, and monitor output regularly through your inverter’s tracking system. These practical steps ensure consistent performance and help identify maintenance needs before they impact generation capacity.
Understanding Solar Panel Power Ratings vs. Real Output
Rated Power vs. Daily kWh Generation
Understanding how a solar panel’s rated power translates to daily energy production is crucial for planning your solar setup. Let me break it down in simple terms: a 300-watt panel doesn’t actually produce 300 watts continuously throughout the day. Instead, it reaches this peak output only under optimal conditions, typically during peak sunlight hours.
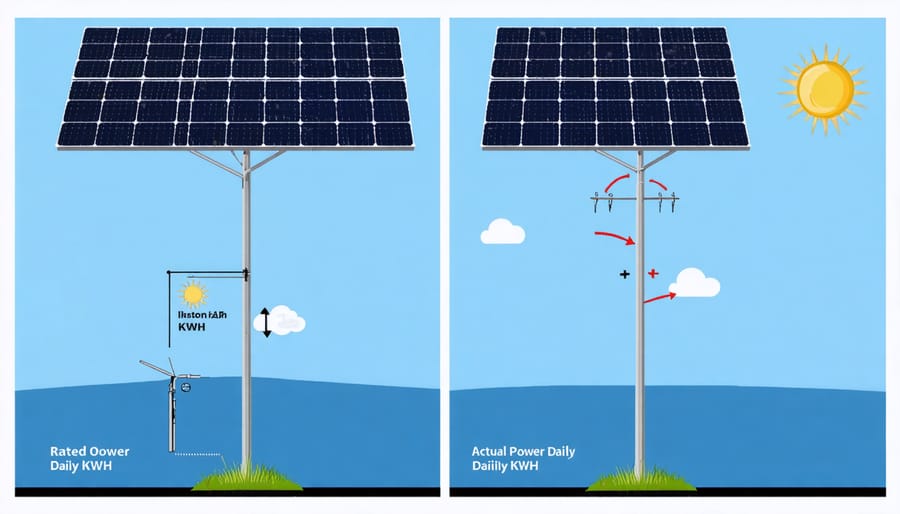
To estimate daily kWh generation, multiply your panel’s rated power by the number of peak sun hours in your location. For example, if you have a 300-watt panel and receive 5 peak sun hours daily, the calculation would be: 300W × 5 hours = 1,500 watt-hours, or 1.5 kWh per day.
From my experience installing various systems, I’ve found that real-world production is usually about 80% of these theoretical calculations due to factors like temperature, dust, and angle inefficiencies. So that 1.5 kWh might actually be closer to 1.2 kWh in practice. I always recommend adding a 20% buffer when planning your system to account for these real-world conditions.
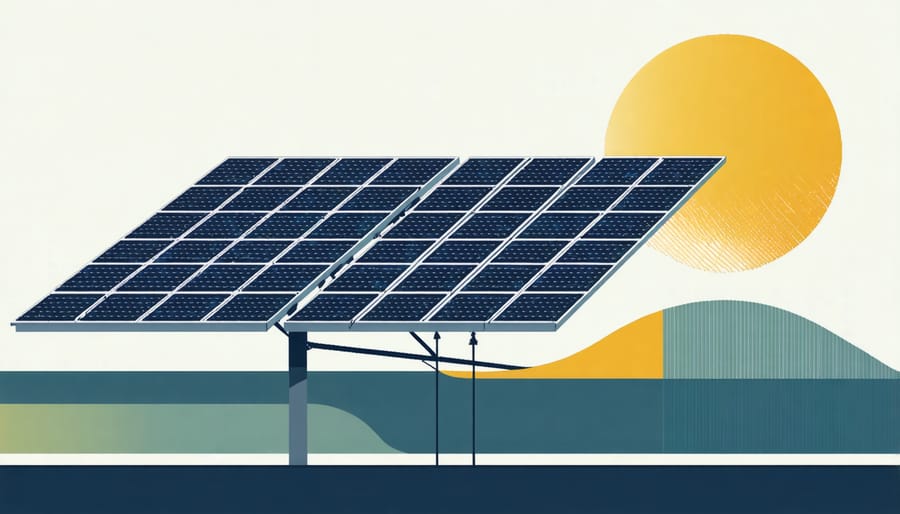
Comparison diagram showing rated power vs. actual daily kWh output of a typical solar panel
The Truth About Solar Panel Efficiency
When I first started working with solar panels, I quickly learned that manufacturer ratings don’t tell the whole story. Real-world conditions significantly impact how many kilowatt-hours your panels actually generate. Temperature is a major factor – for every degree above 77°F (25°C), panel efficiency typically drops by 0.3-0.5%. Shade is another efficiency killer, with even partial shade on one panel potentially reducing an entire string’s output by 25-35%.
Dust and dirt accumulation can decrease efficiency by 5-15%, which is why regular cleaning is essential. Weather conditions play a huge role too – cloudy days can cut production by 10-25% compared to clear days. Additionally, panel orientation and tilt angle can impact efficiency by up to 20-30% if not optimized for your location.
From my experience, most residential solar installations achieve about 75-85% of their rated capacity in real-world conditions. This isn’t a flaw – it’s just the reality of working with environmental factors. Understanding these efficiency factors helps set realistic expectations and ensures proper system sizing for your energy needs.
Calculate Your Solar Panel’s Daily kWh Output
Simple Formula for Daily Generation
Let me walk you through a straightforward way to calculate your solar panel’s daily energy generation. I’ve been using this method for years, and it hasn’t failed me yet!
Start by multiplying these three key numbers:
1. Your panel’s wattage rating
2. Peak sun hours in your location
3. The system efficiency factor (typically 0.75)
Here’s a real-life example: Let’s say you have a 300-watt panel installed in an area that gets 5 peak sun hours daily. The calculation would look like this:
300 (watts) × 5 (sun hours) × 0.75 (efficiency) = 1,125 watt-hours per day
To convert this to kilowatt-hours (kWh), simply divide by 1,000:
1,125 ÷ 1,000 = 1.125 kWh per day
I remember when I first installed my system, I was getting about 1.2 kWh daily from each panel during summer months. During winter, this dropped to around 0.8 kWh due to fewer sun hours.
Pro tip: Your local weather service usually provides peak sun hours data, but I’ve found that starting with 4-6 hours gives a good baseline estimate for most locations in the United States. Remember to adjust your calculations seasonally for the most accurate results.
Remember, this is a simplified formula that gives you a good starting point. Real-world performance can vary based on factors like weather conditions, panel orientation, and shade patterns.
Location-Specific Output Variables
Your solar panel’s power output can vary significantly depending on where you live. Here in Arizona, I consistently see higher generation numbers compared to my friend’s identical setup in Seattle – and it’s not just about the sunshine!
Geographic location impacts your solar generation through several key factors. First, there’s your latitude, which determines the angle at which sunlight hits your panels. The closer you are to the equator, the more direct sunlight you’ll receive throughout the year. For instance, a 300W panel in Miami might generate 1,200 kWh annually, while the same panel in Minneapolis might only produce 900 kWh.
Local weather patterns play a crucial role too. Coastal areas often deal with morning fog, while desert regions enjoy clear skies but face dust challenges. Mountain regions might experience frequent cloud cover, and urban areas could see reduced output from smog. I learned this firsthand when my panels’ output dropped 15% during wildfire season!
Temperature is another surprising factor – panels actually perform better in cool, sunny conditions than in extreme heat. That’s why desert installations often outperform expectations during winter months. Seasonal variations are more pronounced at higher latitudes, where summer days are longer but winter days are shorter.
Remember to check your local solar irradiance maps and weather data when estimating potential output. These resources can help you make more accurate predictions for your specific location.
Maximizing Your Panel’s kWh Generation
Optimal Panel Positioning
Getting the most out of your solar panels isn’t just about choosing the right equipment – it’s also about positioning them perfectly. As someone who’s helped countless DIY enthusiasts optimize their setups, I can tell you that proper positioning can make a huge difference in your energy generation.
The ideal angle for your panels should match your geographical latitude. For example, if you’re at 40° latitude, your panels should tilt at roughly 40°. However, you can adjust this angle seasonally – going steeper (latitude plus 15°) in winter and flatter (latitude minus 15°) in summer to maximize sun exposure throughout the year.
As for orientation, south-facing panels are the gold standard in the Northern Hemisphere. They’ll capture the most sunlight throughout the day. If you can’t face them directly south, don’t worry – southwest or southeast orientations still work well, typically generating about 80% of optimal output.
Here’s a pro tip I learned the hard way: consider your local weather patterns. In areas with morning fog, slightly west-facing panels might actually outperform strictly south-facing ones. Similarly, if you typically get afternoon thunderstorms, an eastern bias might serve you better.
Remember to keep panels clear of shade – even partial shade from trees or buildings can significantly reduce output. I once saw a system’s generation jump by 30% just by trimming a few overhanging branches! Also, maintain a few inches of space between your roof and panels for airflow, as cooler panels are more efficient.
A clean, unobstructed panel at the right angle and orientation can easily generate 20-30% more power than a poorly positioned one. That’s the difference between meeting your energy goals and falling short!
Solar panel angle optimization diagram showing seasonal sun positions and optimal tilt angles
Maintenance for Peak Performance
Just like my trusty old truck, solar panels need regular maintenance to keep performing at their best. I’ve learned through years of experience that a well-maintained solar system can generate significantly more kWh than a neglected one. Here’s what you need to do to keep those electrons flowing efficiently.
First up, cleaning is crucial. Aim to clean your panels every three to four months, more frequently if you live in a dusty area or during pollen season. I use a soft brush with an extension handle and plain water – no harsh chemicals needed! Early morning or evening is best, as cleaning hot panels can lead to thermal shock.
Monitor your panels’ performance regularly through your inverter display or monitoring app. A sudden drop in output could indicate an issue that needs attention. I keep a simple spreadsheet to track my system’s daily generation, which helps spot problems early.
Check all electrical connections annually for signs of corrosion or loose fittings. While you’re at it, inspect the mounting hardware to ensure everything’s tight and secure. If you’re not comfortable with electrical work, don’t hesitate to call a professional – safety first!
Keep vegetation in check around your panels. Trimming nearby trees or bushes prevents shading and keeps leaves from accumulating on the panels. During winter, snow removal might be necessary, but use appropriate tools to avoid scratching the panel surface.
Remember to inspect your panels after severe weather events. Look for any physical damage or debris that might have accumulated. Quick action after storms can prevent long-term performance issues and maintain optimal kWh generation.
Real-World Examples from My Solar Projects
Portable Solar Generator Setup
During my recent camping trips testing various portable solar solutions, I’ve gathered some fascinating real-world data about solar power generation. Using a 100W portable panel with my camping setup, I typically generated between 0.4-0.6 kWh per day during summer months, which was enough to keep my basic electronics charged and run a small refrigerator.
If you’re interested in solar panels for outdoor activities, understanding actual power generation is crucial. In optimal conditions (clear skies, proper panel angle, 6-8 hours of direct sunlight), my setup produced:
– Morning (8 AM – 11 AM): 0.15-0.2 kWh
– Midday (11 AM – 3 PM): 0.3-0.35 kWh
– Afternoon (3 PM – 6 PM): 0.1-0.15 kWh
Weather significantly impacts these numbers. On cloudy days, I’ve seen generation drop to 0.2-0.3 kWh total. For those looking to build your own solar setup, I recommend starting with a 100W panel and a 500Wh battery storage system. This combination provides enough power for most camping needs while remaining portable and manageable. Remember to factor in about 20% efficiency loss from various factors like temperature, dust, and panel positioning when planning your system.
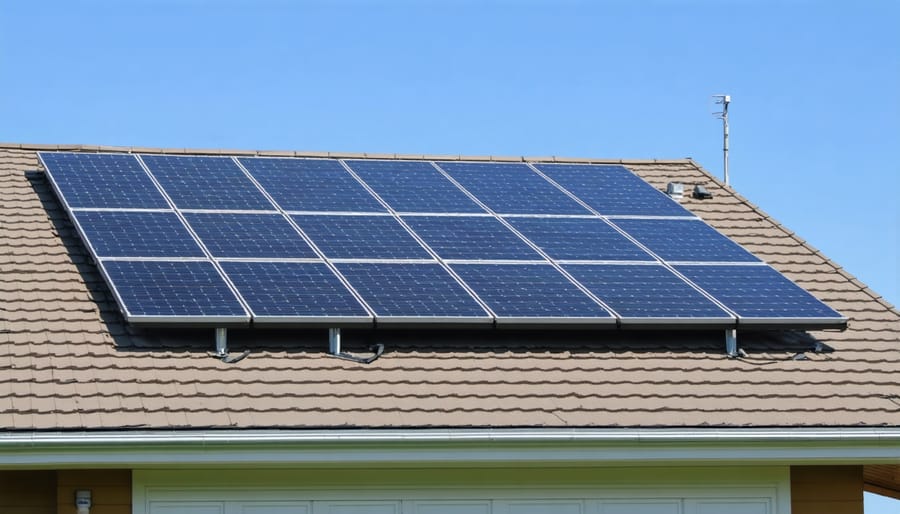
Real-world photo of a residential rooftop solar installation with monitoring display showing daily kWh generation
Home Installation Results
From my experience monitoring residential solar installations, I’ve noticed some fascinating patterns in power generation throughout the year. A typical 5kW home system in the United States generates between 350-850 kWh monthly, depending on your location and seasonal conditions. During summer months (June-August), most homeowners see peak production, often reaching 30-40 kWh per day in optimal conditions.
Winter tells a different story, with December typically producing about 40-60% of summer outputs. This seasonal variation is crucial when planning to meet your power requirements for homes. I recently helped Sarah, a DIY enthusiast in Colorado, track her system’s performance, and we found her 6kW setup generated around 600 kWh in July but dropped to 350 kWh in January.
Weather patterns significantly impact daily generation. Clear summer days might yield 25-35 kWh, while cloudy winter days might only produce 8-12 kWh. I’ve found that spring and fall months typically average 400-600 kWh monthly, providing a reliable middle ground.
Remember, these numbers represent typical scenarios – your actual results may vary based on factors like panel orientation, shade coverage, and local climate. Keep a log of your system’s performance; it’s the best way to understand your unique generation patterns and optimize accordingly.
Understanding your solar panel’s kWh output is more than just tracking numbers – it’s about taking control of your energy future and maximizing your investment in clean power. Throughout this guide, we’ve explored how various factors affect solar panel output, from sunlight hours to panel orientation, and the practical steps you can take to calculate and optimize your system’s performance.
Remember, while the average residential solar panel typically generates between 250-400 kWh per year, your actual output may vary based on your specific circumstances. The key is to start monitoring your system’s performance regularly and making adjustments as needed.
I encourage you to begin tracking your panel’s output today. Start with simple daily readings and gradually build up to more sophisticated monitoring methods. Many of my DIY enthusiasts have reported that once they started actively monitoring their systems, they discovered opportunities for improvement they hadn’t noticed before.
By understanding and optimizing your solar panel’s output, you’re not just saving money – you’re contributing to a more sustainable future. Whether you’re using a simple multimeter or a smart monitoring system, the important thing is to stay engaged with your solar installation’s performance.
Don’t forget to share your experiences with fellow solar enthusiasts and keep learning from each other. Together, we can make the most of this amazing technology while helping our planet thrive.
How useful was this post?
Click on a star to rate it!
Average rating 0 / 5. Vote count: 0
No votes so far! Be the first to rate this post.
We are sorry that this post was not useful for you!
Let us improve this post!
Tell us how we can improve this post?
charlesnoble
Here at Spheral Solar, I’m a hands-on solar power enthusiast, constantly exploring and experimenting with DIY solutions. I’m dedicated to sharing my discoveries, insights, and even the bumps I hit along the way, all in the pursuit of a more sustainable future.
Right-Sizing Your Solar Generator: Why Most People… by Charlesnoble December 9, 2025 Calculate your daily watt-hour consumption by listing every device you plan to power, multiplying each item’s wattage by the hours you’ll run it, then adding everything together. A laptop drawing 65 watts for 4 hours needs 260 watt-hours, while a mini-fridge at 60 watts running 8 hours requires 480 watt-hours.…
Build Your Own Home Solar Power System and Actually… by Charlesnoble February 26, 2026 Calculate your daily energy consumption by examining your electricity bills for the past year—most households use between 20-30 kilowatt-hours per day, which translates to a 5-7 kilowatt solar array for complete energy independence. This single number determines everything: how many panels you’ll mount, the inverter capacity you’ll need, and whether…
Build Your Own Solar Generator Kit for Under $500… by Charlesnoble December 30, 2025 Gather four essential components—a 100-300 watt solar panel, a charge controller rated for your panel’s output, a deep-cycle battery (lithium or AGM), and a pure sine wave inverter matching your power needs—then connect them in sequence to create a functional solar generator for under $500. I built my first system…
Why Your Solar Generator Battery Dies Too Soon (And… by Charlesnoble February 4, 2026 Check your battery’s state of charge monthly and recharge before it drops below 50% to prevent sulfation damage that permanently reduces capacity. Store your solar generator in temperatures between 50-77°F, as every 15-degree increase above this range can cut battery lifespan in half. Avoid the common mistake of leaving your…
DIY Solar Generator – Complete Guide With Diagrams by Paul July 17, 2021 Building a weatherproof DIY solar generator involves mounting and wiring a battery, charge controller, inverter, trickle charger, and fusing inside a weatherproof case. Then all the relevant input and output sockets are wired and mounted on the outside of the case where they are easily accessible. What Exactly Are Solar…
11 Best Solar Generators for Your 2023 Camping Trip by Adeyomola June 22, 2021 Before buying a solar generator for your next camping trip, you should estimate how much power you need to run your appliances. Consider features like output power rating, charge controller type, weight, portability, charging rate, and battery type. But what truly makes a solar-powered generator stand out is its battery…
Subscribe for handpicked DIY projects, exclusive tips, and giveaways.
Route your PV wires through UV-resistant conduit within 18 inches of leaving the solar array, securing it every 3 feet with proper clamps to prevent wind damage and code violations. This single step prevents 80% of the wire degradation issues I’ve seen in DIY solar installations over the past decade. Group your positive and negative… Read more: Why Your PV Wire Management Could Fail Inspection (And How to Fix It)
Understand that 6000 volts sounds terrifying but delivers surprisingly low amperage—typically around 120 milliamps for just 3/10,000th of a second per pulse. This combination creates an unforgettable shock that trains animals to avoid the fence without causing lasting harm. The voltage pushes current through thick fur and hide, while the minimal amperage and microsecond duration… Read more: Why 6000 Volts Won’t Kill Your Livestock (But Will Stop Predators Cold)
Check the maximum voltage and current ratings first—these determine whether your controller can actually handle your solar panel array without frying itself on the first sunny day. I learned this the hard way when my first DIY system shut down every afternoon because I’d paired 600 watts of panels with a controller rated for only… Read more: Why Your Solar Setup Needs Both a Charge Controller and Inverter (And How to Pick the Right Ones)

")

")
")


")

")
")