How to Run Functional Performance Testing on Your DIY Solar System (Volume Testing Explained)
Updated:
Functional performance testing measures whether your solar array is delivering the energy output it’s supposed to deliver over a defined period, typically tracking total kilowatt-hours (kWh) produced against your system’s theoretical capacity. For a 70 kWh benchmark (whether that’s daily output for a larger residential system or a weekly total for a smaller setup), this testing verifies your panels, inverters, and wiring are working together as efficiently as the spec sheets promised. Unlike passive monitoring that just logs numbers, functional performance testing is an active diagnostic process where you compare real-world production data against calculated expectations, then troubleshoot any gaps.
Most DIYers who installed their own systems worry about the same thing: did I wire everything correctly? Are my panels actually generating what the manufacturer claimed? A 10% drop might be normal shading or temperature losses. A 30% drop means something’s wrong, and you need to find it before you lose months of potential energy harvest.
I’ve talked to dozens of solar hobbyists who assumed their systems were fine because the inverter lights blinked green, only to discover through proper volume testing that they were leaving 20-40% of their capacity on the table due to a single misconfigured string or a failing bypass diode. The good news? You don’t need expensive equipment or an engineering degree. With a basic multimeter, your inverter’s monitoring app, and a spreadsheet, you can run a complete functional performance test in about two hours of active work spread across a week or longer measurement window.
This guide walks you through the entire process: gathering baseline data, selecting your test volume and timeframe, recording measurements safely, calculating your performance ratio, and diagnosing common issues when your numbers don’t match expectations.
Key Takeaway: Volume testing measures total kWh produced over time against expectations, while PR testing calculates efficiency as a percentage ratio. Together, they give you the complete picture, volume shows if your system delivers enough energy, and PR reveals whether it’s working efficiently to get there.
What You’ll Need: Tools and Materials for Volume Testing
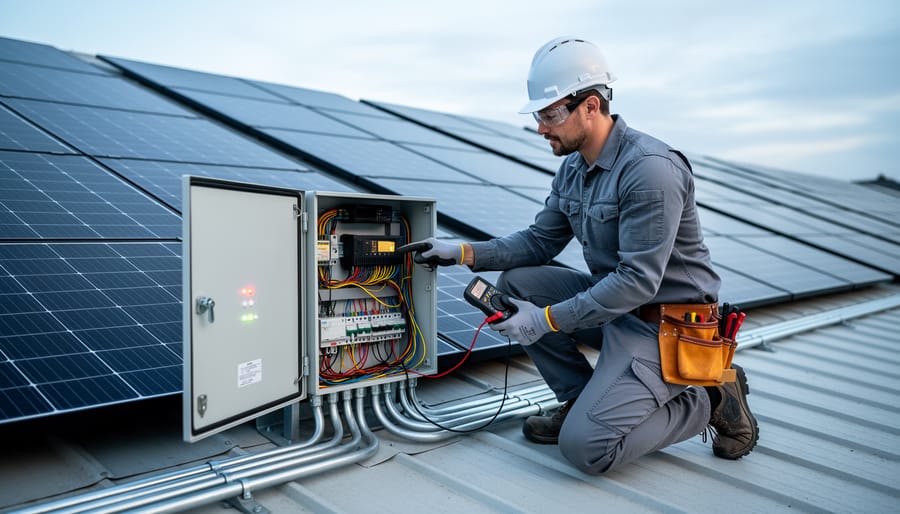
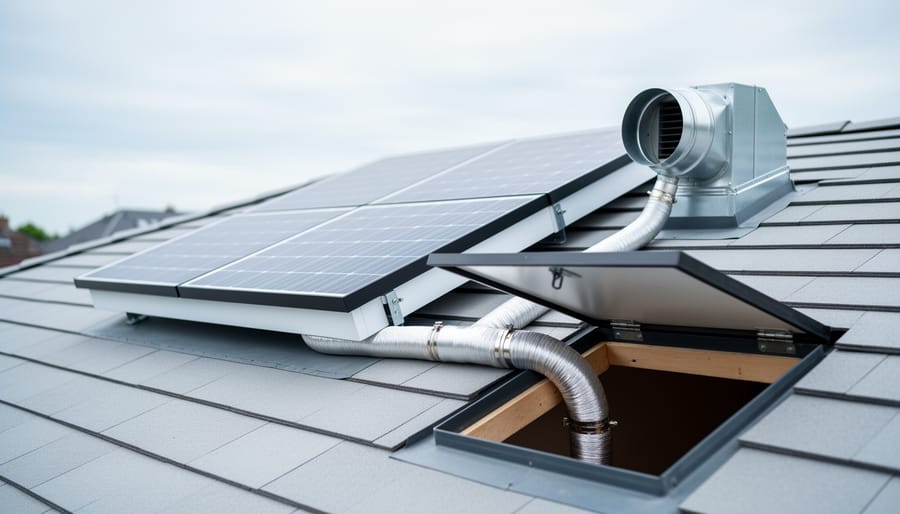
A clear view of a DIY rooftop solar installation helps ground the article’s volume testing workflow in real hardware and everyday context.
You don’t need a lab full of expensive gear to run accurate volume testing. Most DIYers already have some of these tools, and the rest can be sourced affordably or substituted with free alternatives.
Required Equipment and Resources:
Energy meter or monitoring systemYour inverter’s built-in monitoring (most modern units display cumulative kWh production) or a dedicated solar meter. If you need to choose a power meter separately, expect $50-200 depending on features.
System specifications sheetYour panel wattage, inverter capacity, array tilt, and azimuth. This establishes your baseline production expectations.
Local solar irradiance dataFree from NREL’s PVWatts calculator or your regional meteorological service. You need average kWh/m²/day for your test period.
Data logging methodA simple spreadsheet works fine. Google Sheets or Excel lets you track daily kWh readings and calculate totals easily.
Calendar or scheduling toolMark your test start and end dates to maintain consistent measurement intervals.
Optional Tools for Enhanced Accuracy:
Dedicated data logger ($100-400), Automates collection at set intervals, reducing human error and giving you granular hourly or minute-by-minute data.
Portable irradiance meter ($200-600), Measures actual sunlight hitting your panels rather than relying on regional estimates. Useful for diagnosing shading issues.
Monitoring app with export functionsMany inverter manufacturers offer free apps (SolarEdge, Enphase Enlighten, SMA Sunny Portal) that export CSV files for deeper analysis.
Weather station or thermometerTracks ambient and panel temperature, which affects output. Helps explain variance on exceptionally hot or cold days.
The beauty of volume testing is its flexibility. Start with what you have, even just your inverter display and a notebook, and upgrade your toolkit as you get more serious about performance tracking.
Safety First: Important Warnings Before You Start
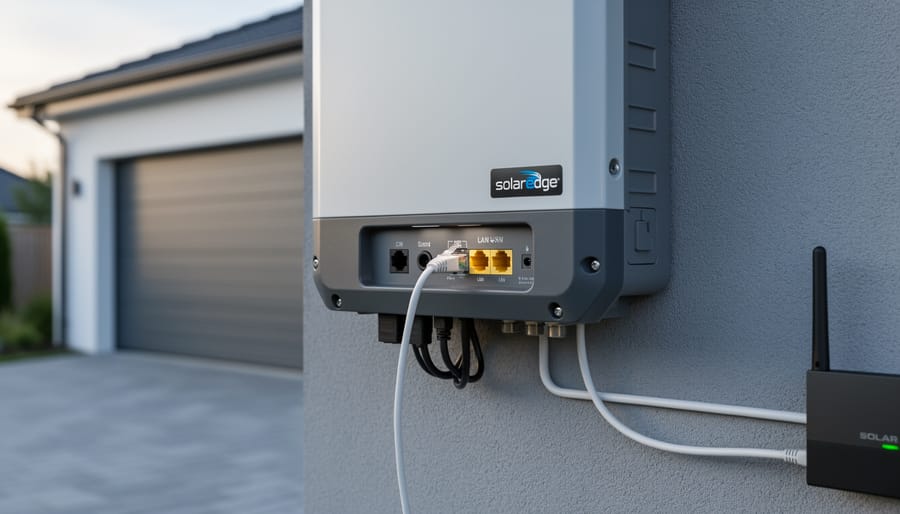
Monitoring hardware close to the inverter installation is shown as the safe, non-invasive place to start functional volume testing.
Before you start testing, remember that solar systems carry high DC voltage even on cloudy days. Your job during volume testing is purely observational, you’ll track the right data from your monitoring equipment without touching any electrical components. Think of yourself as a detective gathering evidence, not a technician performing repairs.
Warning: Never open inverter enclosures, junction boxes, or touch any wiring during testing, work exclusively with monitoring displays, apps, and external sensors.
Beyond electrical safety, protect your data. Before starting your test period, export and save a backup of your existing monitoring history. If your inverter or data logger resets during testing, you’ll lose your baseline. I learned this the hard way when a firmware update wiped three weeks of carefully logged data mid-test.
Avoid shutting down your system unnecessarily during the testing window. Each restart can create data gaps and skew your volume calculations. If your inverter has a “standby” mode for routine checks, use that instead of a full power cycle.
Know your limits. If you notice sparking, burning smells, error codes you can’t identify, or physical damage to equipment while reviewing your system, stop immediately and contact a licensed electrician. Volume testing is about reading numbers safely, not diagnosing dangerous electrical faults. There’s no shame in calling a professional when something looks wrong, protecting yourself and your investment is always the smart choice.
Understanding Volume Testing vs. Standard PR Monitoring
Changing weather over real PV panels emphasizes why volume testing must account for environmental conditions that affect energy yield.
Performance Ratio monitoring and volume testing serve different purposes, though they work beautifully together. Think of PR monitoring as checking your car’s fuel efficiency, you’re measuring how well your system converts available sunlight into electricity, expressed as a percentage. Volume testing, on the other hand, is like tracking total miles driven: it measures the actual kilowatt-hours your system delivers over a specific period, comparing that concrete output against what you expected to produce.
Here’s where things get practical. When you see “volume: 70” in testing contexts, it typically refers to one of three things: a monthly production target of 70 kWh, a 70-day test duration, or a threshold production volume that triggers further analysis. In most DIY scenarios, you’re looking at either monthly production (70 kWh is realistic for a small 1-2 panel setup) or a test window of around 70 days, which captures meaningful seasonal variation without dragging on too long.
The real power emerges when you use both approaches strategically. Continuous PR monitoring runs in the background, alerting you when efficiency dips. Volume testing is something you schedule deliberately, perhaps quarterly, or when you suspect underperformance. If your spring volume test shows only 60 kWh when you expected 70, but your PR stays at 85%, you know the shortfall isn’t system inefficiency; it’s likely environmental (more cloudy days than typical). Conversely, hitting your volume target with a dropping PR might mean your inverter wasting power through conversion losses, you’re producing enough now, but inefficiency is creeping in.
Volume testing shines for seasonal verification (did winter actually cut my production by the predicted 40%?) and troubleshooting specific concerns (is that new tree causing real losses?). It gives you hard numbers to work with, not just percentages.
Step-by-Step: How to Conduct Functional Performance Volume Testing
Step 1: Calculate Your Expected Volume
Here’s the foundation of any meaningful volume test: knowing what your system should produce. Without this baseline, you’re just collecting numbers with nothing to compare them against.
Start with your system’s nameplate capacity, that’s the total wattage of all your panels combined. A 5 kW system, for example, is your starting point. Next, find your location’s average daily peak sun hours. The NREL PVWatts database gives you this free; most US locations see 3.5 to 6 peak hours depending on season and geography.
Multiply nameplate capacity by daily peak sun hours, then by the number of days in your test period. For our 5 kW system in a location with 5 peak sun hours, that’s 5 kW × 5 hours × 30 days = 750 kWh for a month-long test.
But real-world systems don’t hit 100% efficiency. Apply a conservative Performance Ratio of 0.80 (accounting for inverter losses, wiring resistance, temperature effects). So 750 kWh × 0.80 = 600 kWh expected volume.
The Spheral Solar calculator handles this math instantly, just plug in your system specs and location. Now you’ve got your target number.
Step 2: Set Up Your Monitoring Window
Choose a 30-day monitoring window for your volume test. This duration smooths out daily weather variations while remaining short enough to catch performance issues before they worsen. A full month also simplifies comparison with utility bills and historical data.
Pick your start date strategically. Avoid beginning tests during severe weather events or periods when you know your system will be partially shaded by seasonal obstacles. The middle of any month works well, just ensure you can commit to consistent data checks throughout.
Before you begin, verify your monitoring equipment is working properly. Check that your inverter display matches your energy meter readings within 2-3%. If they’re off by more, investigate why before starting your test. Most inverters have a reset option for daily or monthly totals, use this feature to zero out production counts on day one.
Create a simple spreadsheet or use a notebook to log daily kWh production. Include columns for date, cumulative kWh, weather conditions, and any notes about system downtime or shading events. This template becomes your testing record and makes the final comparison much easier.
Set a calendar reminder for your end date so you don’t miss capturing that final reading.
Step 3: Track Environmental Variables
Your solar panels don’t operate in a vacuum, they respond to real-world conditions that change daily. To interpret your volume test results fairly, you need to track the environmental factors that influenced production during your monitoring window.
Start by recording daily weather conditions. Note cloudy periods, rain, snow, or unusual fog that reduces sunlight. Your local weather service’s historical data can fill gaps if you miss a day. I learned this the hard way when my first volume test showed 78% of expected output, until I checked records and realized we’d had five more overcast days than normal that month.
Temperature matters more than you’d think. Record high and low temps each day, since panel efficiency drops about 0.5% for every degree Celsius above 25°C. On a scorching July day, your panels might be producing 10-15% less than the same irradiance would yield in cool spring weather.
Document any shading changes. Did leaves fill in on nearby trees? New construction casting shadows? A chimney shadow that didn’t exist in winter? Snap photos if shading patterns shift.
Finally, log all system downtime, planned maintenance, inverter resets, grid outages, anything that stopped production. Even 30 minutes matters when calculating total volume.
Step 4: Collect and Log Your Volume Data
Now that your monitoring window is active and you’re tracking environmental variables, it’s time to establish a consistent data collection routine. I check my system every three days, frequent enough to catch issues early, but not so often that it becomes a chore.
Your inverter display shows cumulative production, usually under “Total Energy” or “Lifetime kWh.” Record this figure at the same time each check-in (I use Sunday mornings with coffee). Subtract your starting baseline to get your test period production. Most monitoring apps like SolarEdge or Enphase automatically log daily totals, which saves manual math.
Watch for sudden drops between readings. A 30% dip might indicate a tripped breaker, dirty panels, or inverter faults. Note anything unusual in your log: “Day 12, cloudy week” or “Day 18, cleaned panels.” These annotations explain variance later.
Keep your measurement method identical throughout. Don’t switch between the inverter screen and the app mid-test, they sometimes show slightly different values due to rounding or update delays, which throws off your accuracy.
Step 5: Calculate Your Actual vs. Expected Volume
Once you’ve reached the end of your test period, it’s time to do the math. Pull your total kWh production from your monitoring logs, let’s say your system generated 285 kWh over 30 days. Compare that to the expected volume you calculated in Step 1. If you estimated 320 kWh, you’re sitting at about 89% of expected output.
The calculation is straightforward: divide actual by expected, then multiply by 100. In this example, 285 ÷ 320 × 100 = 89.06%. Most healthy residential systems land between 85-95% of theoretical output when accounting for real-world losses like inverter efficiency, wiring resistance, and soiling.
If you’re below 85%, something needs attention. Above 95%? Either your system’s performing exceptionally well, or your baseline assumptions were too conservative, worth reviewing those irradiance and temperature loss estimates. Document everything in your testing spreadsheet, including the variance percentage and any notes about unusual conditions during the test period.
How to Verify Your Results and What to Do Next
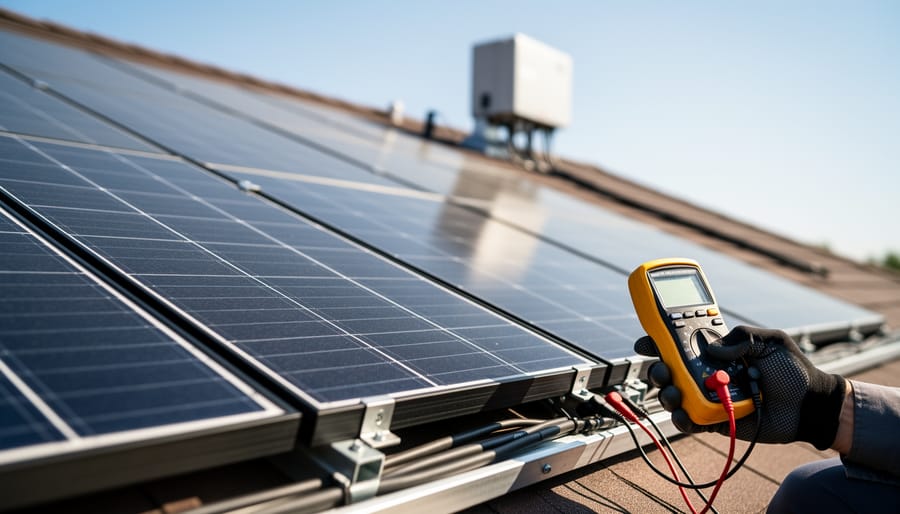
Tools arranged for verification symbolize accurate measurement practices that turn volume-test results into trusted conclusions.
You’ve collected your data and crunched the numbers. Now comes the crucial part: confirming those results actually reflect reality. Start by cross-checking your inverter or monitoring app totals against your utility meter. If you’re grid-tied, your net meter should show exported or consumed kWh that aligns with your production logs. A small discrepancy is normal (different measurement points, slight timing offsets), but a large gap suggests a problem. If you’re seeing a meter numbers mismatch troubleshoot before drawing conclusions about system health.
Next, compare your volume test outcome to a quick Performance Ratio calculation. If your volume came in at 88% of expected but your PR (using actual irradiance data) lands around 87-90%, you’re in the ballpark. Sandia’s performance ratio definitions can help clarify the math. Consistent numbers across methods build confidence. If the figures diverge sharply, revisit your baseline assumptions or check whether your monitoring equipment needs recalibration. Sometimes the simplest fix is to improve solar meter accuracy with better hardware or placement.
What do your results mean for next steps? If you hit 90-100% of expected volume, celebrate. Your system is performing well. Schedule another test in six months to catch any gradual declines. If you landed in the 80-89% range, look for low-hanging fruit: clean the panels, trim shading trees, check for loose connections. Retest in a month to see if tweaks helped. Below 80%? Time for deeper investigation. Inspect wiring, test individual panel outputs, or consult a pro. Borderline results (75-85%) during unusually cloudy or hot test periods might just reflect tough conditions, not system failure. Context matters. Trust your data, but interpret it with common sense.
Common Volume Testing Mistakes (And How to Avoid Them)
Over the years, I’ve watched countless DIYers get misleading results simply because they ran their volume test during a week of heavy cloud cover. Testing during atypical weather is probably the most common mistake, you need representative conditions to get meaningful data. If your test period happens to coincide with unusually cloudy or exceptionally sunny weather, your results won’t reflect normal system performance. The fix is straightforward: either extend your testing window to include more typical days, or check historical weather data for your area and acknowledge the deviation in your notes. I once tested in late spring during what turned out to be the cloudiest May on record, and my numbers looked terrible until I realized the issue wasn’t my panels.
Tip: The single biggest mistake is testing for too short a period, volume tests need at least 2-4 weeks for meaningful results that average out daily weather fluctuations.
Another frequent error is ignoring shading changes between seasons. That tree you barely noticed in winter might be casting significant afternoon shadows by June, drastically affecting your volume output. Compare your current shading situation against when you established your baseline expectations, and adjust accordingly. Misreading inverter data trips people up too, especially when cumulative kWh counters reset or when you’re looking at instantaneous power instead of energy totals. Double-check you’re recording the right metric, total energy produced, not current wattage.
Using wrong baseline assumptions creates false alarms. If you calculated expected volume using peak summer irradiance but ran your test in March, you’ll panic over perfectly normal seasonal variation. Match your expectations to the actual test period. Similarly, comparing incompatible time periods, like February 2025 against July 2024, tells you nothing useful about system health. Always compare apples to apples: same season, similar weather patterns, equivalent day counts.
Frequently Asked Questions About Volume Testing
How often should you actually run volume tests? I get this question constantly, and my answer is quarterly for most DIYers, once at the end of each season. This gives you four solid data points per year without becoming a full-time job. If you suspect an issue, run a test immediately. For brand-new systems, I recommend monthly tests for the first six months to establish your performance baseline, then shift to quarterly.
Can I do volume testing on an off-grid system?
Absolutely, and it’s arguably more important for off-grid setups since you rely entirely on that production. Track your battery bank’s total charge input over the test period instead of grid export, your charge controller data is your friend here.
What if I don’t have a data logger?
Manual logging works fine. Take daily inverter readings at the same time each day, record them in a simple spreadsheet, and calculate your running total. It takes five minutes per day and costs nothing.
Is volume testing enough, or do I need full PR monitoring?
Volume testing gives you the essential health check, think of it as your system’s annual physical. Continuous PR monitoring is the premium option that catches issues faster, but quarterly volume tests will catch 90% of problems before they cost you serious money.
How accurate do my measurements need to be?
Your inverter’s built-in meter is accurate enough for volume testing. Aim for consistency rather than laboratory precision, using the same measurement method each time matters more than absolute accuracy to the tenth of a kilowatt-hour.
What’s a good test volume target for your system size? Calculate it by multiplying your system’s nameplate wattage by the expected sun hours for your test period, then apply an 85% performance ratio. A 5 kW system in an area with 5 sun hours daily should produce roughly 637 kWh over 30 days (5000W × 5 hours × 30 days × 0.85). Your target is hitting 85-95% of this theoretical maximum.
One question that surprises people is whether they should test during winter. Yes, test year-round. Winter tests reveal different issues than summer ones, snow coverage patterns, low-angle shading from objects you never noticed in summer, temperature-related performance quirks. Each season tells part of your system’s story. I learned this the hard way when a winter test revealed that my neighbor’s new fence was shading my lower panels for two hours every December morning.
You now have everything you need to run functional performance volume testing on your own solar system. No specialized degree required, no expensive consultants, just you and the tools you already own (or can access for free). That’s the beauty of taking this hands-on approach, you’re not guessing about your system’s health anymore, you’re measuring it with real data.
I make it a point to run volume tests twice a year, typically in March and September when seasonal shifts can reveal issues before they compound. It takes maybe 20 minutes to set up and another hour at the end to crunch the numbers, but that small investment has caught problems that would have cost me hundreds in lost production. The confidence that comes from knowing your system is performing as it should (or catching inefficiencies early) is worth far more than the time spent.
Try running your first volume test this month. Set your baseline, track for 30 days, and see where you land. Once you’ve got results, I’d love to hear how it went, head over to the Spheral Solar community forum and share your findings. You’ll find plenty of fellow DIYers comparing notes, troubleshooting quirks, and celebrating those satisfying 95%+ performance numbers.
And if you want to dig deeper into your system’s Performance Ratio or play with different scenarios, check out our PR calculator. It’s free, easy to use, and pairs perfectly with the volume testing approach you just learned.
Here’s to knowing exactly what your panels are doing, every single day.
How useful was this post?
Click on a star to rate it!
Average rating 0 / 5. Vote count: 0
No votes so far! Be the first to rate this post.
We are sorry that this post was not useful for you!
Let us improve this post!
Tell us how we can improve this post?
charlesnoble
Here at Spheral Solar, I’m a hands-on solar power enthusiast, constantly exploring and experimenting with DIY solutions. I’m dedicated to sharing my discoveries, insights, and even the bumps I hit along the way, all in the pursuit of a more sustainable future.
How to Run Functional Performance Testing on Your… by Charlesnoble August 17, 2026 Functional performance testing measures whether your DIY solar system delivers the power output it’s designed to produce. You’ll check voltage, current, and total wattage under real-world conditions, then compare those numbers to your system’s nameplate ratings to calculate a Performance Ratio, the gold standard metric that tells you if everything’s…
How to Connect SolarEdge to Ethernet for Seamless… by Charlesnoble July 9, 2026 Connecting your SolarEdge inverter to your home network via Ethernet cable takes about 15 minutes and gives you real-time access to your system’s performance data from any device with internet access. You’ll plug a standard Ethernet cable into the RJ45 port on your inverter (usually labeled “LAN” or “Ethernet”), run…
5 Sources of Electrical Energy Every Solar DIYer… by Charlesnoble July 1, 2026 Electricity powers our homes from five main sources: solar panels, wind turbines, hydroelectric generators, fossil fuel generators, and battery storage systems. If you’re building a reliable off-grid setup or backing up your solar array, understanding how these sources work together transforms a single-point-of-failure system into resilient, year-round power. I learned…
Residential ERV Systems: How They Work with Solar… by Charlesnoble August 9, 2026 A residential ERV (Energy Recovery Ventilator) exchanges stale indoor air with fresh outdoor air while recovering up to 80% of the heating or cooling energy that would otherwise be lost, and when paired with solar power, it delivers year-round ventilation with virtually no grid electricity cost. Unlike a simple exhaust…
How to Install a Whole House Ventilation System… by Charlesnoble July 12, 2026 Installing a whole house ventilation system powered by solar takes about 6 to 8 hours for a moderately skilled DIYer and delivers continuous fresh air circulation without touching your electric bill. The core method involves mounting a solar panel on your roof to power an intake or exhaust fan, routing…
How to Make DIY Solar Tubes for Free Natural… by Charlesnoble July 7, 2026 You can build a DIY solar tube for $50 to $150 and start harvesting natural daylight in a weekend. This simple project combines a reflective tube, clear dome, and diffuser to channel sunlight from your roof into dark interior spaces, delivering illumination equivalent to multiple bulbs without electrical costs or…
Subscribe for handpicked DIY projects, exclusive tips, and giveaways.
Functional performance testing measures whether your solar array is delivering the energy output it’s supposed to deliver over a defined period, typically tracking total kilowatt-hours (kWh) produced against your system’s theoretical capacity. For a 70 kWh benchmark (whether that’s daily output for a larger residential system or a weekly total for a smaller setup), this… Read more: How to Run Functional Performance Testing on Your DIY Solar System (Volume Testing Explained)
Functional performance testing measures whether your DIY solar system delivers the power output it’s designed to produce. You’ll check voltage, current, and total wattage under real-world conditions, then compare those numbers to your system’s nameplate ratings to calculate a Performance Ratio, the gold standard metric that tells you if everything’s working properly. Most DIYers can… Read more: How to Run Functional Performance Testing on Your DIY Solar System
Yes, you can power large water features with solar energy, but success depends on matching your pump’s wattage requirements to an adequately sized solar panel array and battery system. Most substantial pond fountains and waterfalls need pumps ranging from 50 to 300 watts, which typically requires a 100-400 watt solar setup with battery backup to… Read more: Why Your Garden Needs a Large Solar Water Feature (And How to Pick the Right One)