How to Run Functional Performance Testing on Your DIY Solar System
Updated:
Functional performance testing measures whether your DIY solar system delivers the power output it’s designed to produce. You’ll check voltage, current, and total wattage under real-world conditions, then compare those numbers to your system’s nameplate ratings to calculate a Performance Ratio, the gold standard metric that tells you if everything’s working properly. Most DIYers can complete a baseline test in about 45 minutes using a multimeter and a sunny afternoon.
I’ve seen too many backyard solar setups that looked perfect but were quietly underperforming by 20% or more. The panels were mounted, the inverter hummed along, and the batteries charged, but nobody had actually verified the numbers. That’s the gap functional performance testing fills. It’s not about whether your system works at all; it’s about whether it works as well as it should.
Here’s the reality: solar panels degrade, connections corrode, and shadows shift as trees grow. Without testing, you’re flying blind. A system that produced 3,000 watts last summer might only hit 2,400 watts this year, and you’d never know unless you measured it. That lost 600 watts could mean the difference between energy independence and still relying on the grid more than you planned.
The good news? You don’t need expensive monitoring equipment or a professional audit. A basic multimeter, a sunny day with minimal clouds, and about an hour of your time will give you rock-solid data about your system’s health. You’ll establish a performance baseline, spot problems before they become expensive, and gain the confidence that comes from truly understanding what your panels are doing up there on the roof.
This guide walks you through the entire process, from gathering your tools to interpreting your results and deciding what action to take next.
Key Takeaway: Healthy DIY solar systems typically achieve 75-85% of their theoretical maximum output under real-world conditions. Lower performance isn’t always a problem if temperature and shading explain the difference, but consistent underperformance below 70% signals an issue worth investigating.
What You’ll Need for Functional Performance Testing
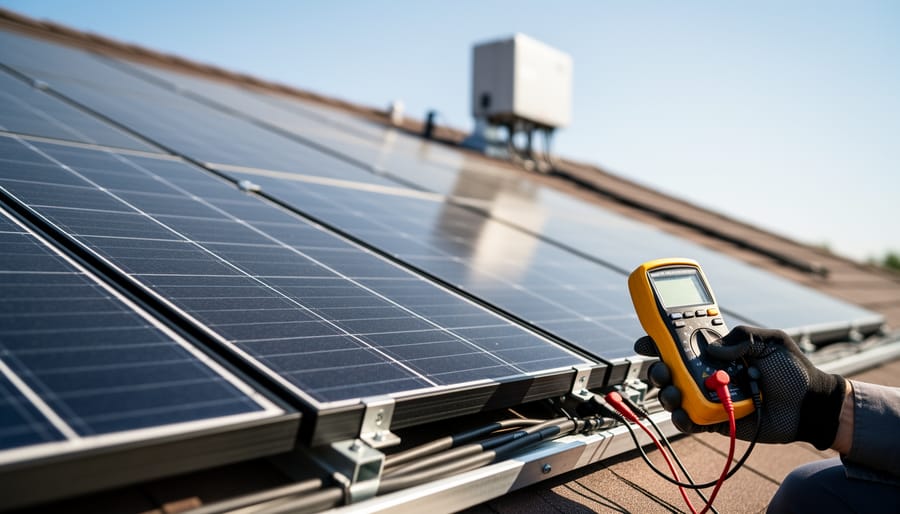
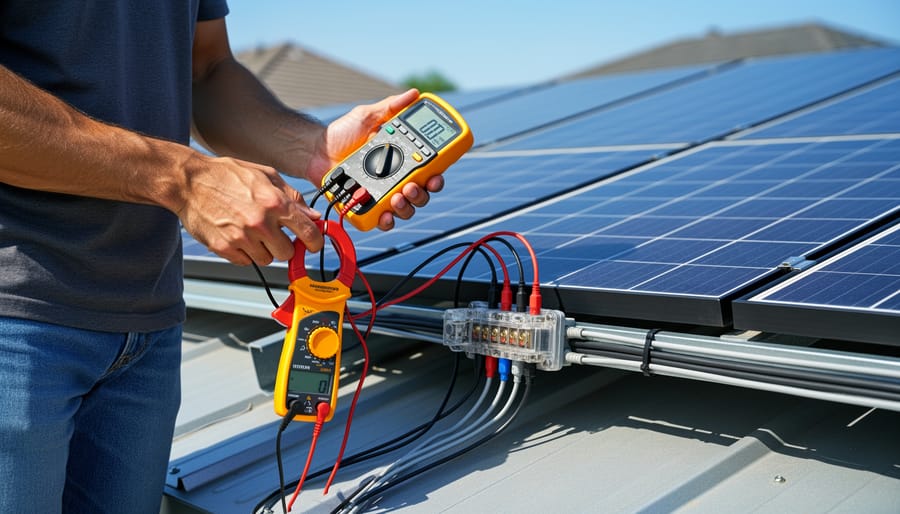
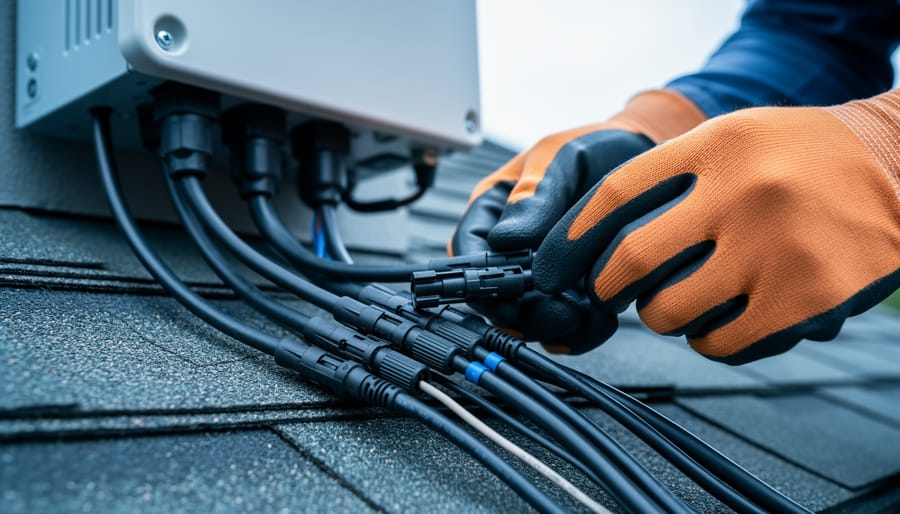
A DIYer tests solar wiring with a multimeter and clamp meter, showing the practical tools used for functional performance checks.
You don’t need a professional testing rig to verify your solar system is actually delivering the power you expect. Most functional performance testing can be done with tools you probably already own or can pick up for under $100 total. Here’s what you’ll need to conduct a proper test on your DIY array.
Core Testing Equipment
These are the essentials for measuring your system’s electrical performance:
Digital multimetermeasures voltage and current (DC models work fine; expect $20-50 for a reliable unit)
Clamp meterclips around wires to measure current without breaking connections (budget-friendly models start around $30)
Irradiance meter or smartphone light meter appmeasures solar intensity in W/m² (apps like Solar Meter are free; dedicated meters run $150+ but aren’t necessary for most DIYers)
Infrared thermometer or contact thermometerchecks panel surface temperature, which affects output ($15-30 for a basic IR gun)
Notebook or smartphonerecords all measurements with timestamps and conditions
Budget-Friendly Alternatives
If you’re just getting started, you can simplify further. A basic multimeter alone will get you 80% of the way there. For irradiance, you can test on clear, sunny days around solar noon and assume roughly 1000 W/m² as your baseline instead of measuring precisely. Your phone’s weather app gives you ambient temperature, and you can estimate panel temperature by adding 20-30°C to the air temperature on a sunny day.
Nice-to-Have Tools
These aren’t essential but make repeated testing easier. A data logging multimeter (around $60-100) automatically records readings over time instead of you writing everything down. Cable labels and colored tape help you keep track of which string or panel you’re testing, especially if you have multiple arrays. A simple spreadsheet template on your laptop turns raw numbers into performance trends you can actually understand.
I’ve done hundreds of these tests with nothing fancier than a $35 multimeter from the hardware store and my phone’s notepad app. Start with what you have, and you’ll quickly figure out if you need anything more sophisticated.
Safety First: What to Check Before You Start
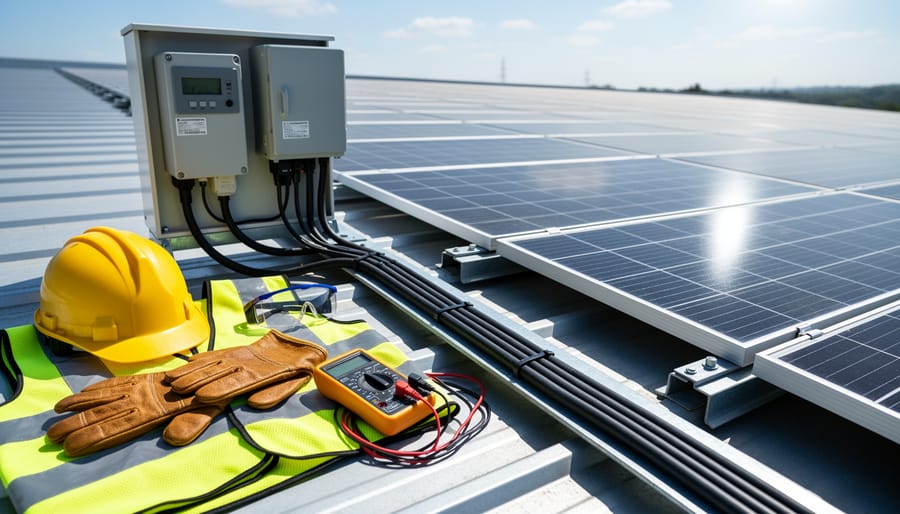
Safety gear positioned near an operating solar setup highlights the importance of PPE and careful handling before live testing.
Before you clip on a single test lead, you need to understand what makes functional performance testing different from casual voltage checks: you’re working with a live, energized system that can deliver serious electrical shock or arc flash. Unlike pre-installation wiring checks, functional testing requires the solar array to be producing power under real sunlight, which means panels, wiring, and charge controllers are all electrically active.
Warning: Solar panels produce high DC voltage whenever exposed to light and cannot be “switched off” at the panel level. Always treat all wiring as live, never work alone, and verify your multimeter is rated for DC voltage testing before proceeding.
Start by checking the weather. Don’t test during storms, high winds, or when rain is approaching, moisture and electricity don’t mix, and slippery roof surfaces multiply fall risks. Early morning or late afternoon often provides stable, moderate irradiance without extreme heat that makes panels and roof surfaces dangerously hot to touch.
Wear proper personal protective equipment: insulated gloves rated for electrical work, non-slip footwear with good ankle support, and safety glasses. If you’re working on a rooftop array, use a properly anchored fall-arrest harness and have a spotter on the ground who can call for help if needed.
Know when to shut down. While functional testing requires an operating system, you should identify your emergency disconnect points before you start, where your main breaker is, how to isolate the array if something goes wrong. If you need to physically disconnect wiring to test short-circuit current, shut down the charge controller or inverter first, then work quickly to minimize exposure time.
Never bypass safety devices, touch bare conductors with your hands, or lean metal tools across terminals. Respect the system, it’s producing real power, and DC voltage doesn’t let go the way AC does.
Understanding What Functional Performance Testing Measures
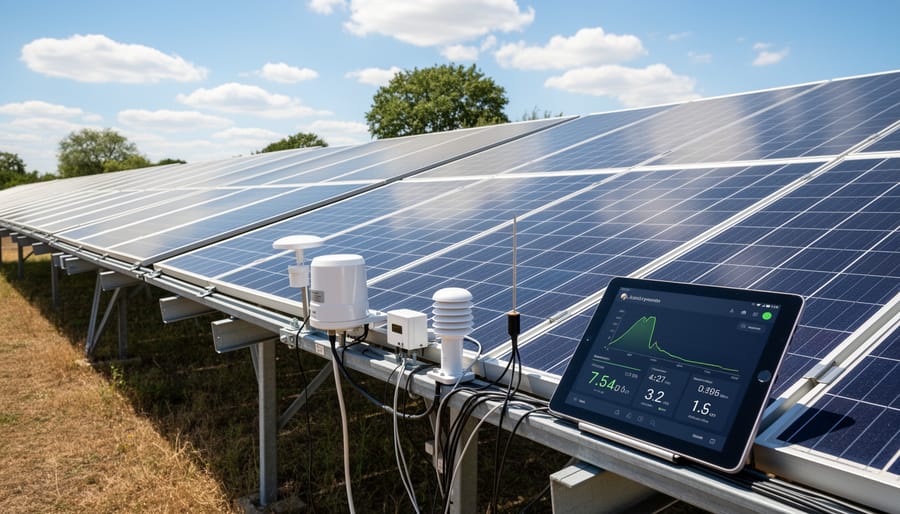
Sunlit solar panels in real-world conditions set the scene for functional performance testing tied to environmental variables like irradiance and temperature.
Functional performance testing measures how effectively your solar panels convert sunlight into usable electricity under real-world conditions. Think of it like checking your car’s actual fuel economy on a road trip rather than just trusting the manufacturer’s estimate. The most important metric is actual power output, which you’ll compare against your panels’ rated capacity adjusted for current conditions. If your 300-watt panel produces 270 watts under full sun at the right temperature, that’s excellent. If it’s only hitting 180 watts, something needs attention.
Voltage and current under load tell you how your system behaves when it’s actually working, not just sitting idle. Your panels might show perfect open-circuit voltage but drop significantly when connected to your batteries or inverter. That voltage drop, combined with current flow, reveals whether your wiring is adequate, your connections are solid, and your charge controller is extracting maximum power. Temperature affects everything: panels lose about 0.5% efficiency for every degree Celsius above 25°C. A panel reading 45°C on a hot roof will naturally produce less than its nameplate rating, and that’s normal.
All these individual measurements feed into your Performance Ratio, the single number that captures your system’s overall health. PR compares what your system actually produces to what it should produce given the available sunlight. A PR of 80% means your system delivers 80% of its theoretical output after accounting for all real-world losses like temperature, wiring resistance, inverter efficiency, and component aging. Tracking PR over months and years shows whether your system maintains consistent performance or gradually declines, making it the most valuable long-term monitoring metric for DIY solar owners.
Step-by-Step: Running Your Functional Performance Test
Step 1: Record Environmental Conditions
Before you can tell whether your solar system is actually performing well, you need to establish what “normal” looks like right now. Start by recording four critical baseline measurements: the current solar irradiance (how much sunlight is hitting your panels), ambient air temperature, panel surface temperature, and the exact time of day.
For irradiance, use a dedicated solar irradiance meter if you have one, or download a free solar calculator app that estimates irradiance based on your location and time, many DIYers find these surprisingly accurate for testing purposes. Aim for midday testing when irradiance is strongest and most stable, ideally above 800 W/m². Record the ambient temperature with a simple outdoor thermometer placed in the shade near your array, then measure panel surface temperature by carefully touching a non-contact infrared thermometer to the back of a panel. This matters because solar panels lose about 0.5% efficiency for every degree Celsius above 25°C, so hot panels naturally produce less power than their rated capacity suggests.
Write down all four measurements along with the date. These conditions are your reference point, they let you read your solar readings in context rather than just collecting random numbers. Without knowing whether you tested at 1000 W/m² or 400 W/m², your power measurements are nearly meaningless.
Step 2: Measure Open-Circuit Voltage and Short-Circuit Current
With your environmental data recorded, you’re ready to establish your system’s electrical baseline. Open-circuit voltage (Voc) and short-circuit current (Isc) tell you whether each panel or string can still produce its rated electrical characteristics when isolated from the load.
To measure Voc, disconnect the panel from your charge controller or inverter at the MC4 connectors. Set your multimeter to DC voltage, then touch the red probe to the positive terminal and black to negative. You should see a voltage close to the panel’s nameplate Voc, adjusted slightly for temperature. On a hot day, voltage drops a bit; on a cold morning, it rises.
For Isc, switch your multimeter to DC current mode (or use a clamp meter around one wire). Briefly short the positive and negative terminals together through your meter. This reading shows maximum current the panel can deliver in full sun. It should match the panel’s rated Isc within about 10%.
Safety note: Never short a string of multiple panels directly without a meter in the circuit. The combined current can arc dangerously or damage connectors. Test panels individually or use a proper clamp meter on strings.
Reconnect everything securely before moving to the next step. These baseline measurements reveal whether your panels still have their factory electrical potential, separate from system losses.
Step 3: Test Under Operating Load
Now you’re measuring what your system actually delivers under normal working conditions. Unlike the open-circuit and short-circuit tests, your panels stay connected to the charge controller or inverter, actively generating power.
Set your multimeter to measure DC voltage, then probe the input terminals of your charge controller where the solar array connects. You’ll notice this voltage is lower than the Voc you just measured, that’s normal and expected. Your controller is actively pulling power from the panels, which drops the voltage below open-circuit levels.
Next, use your clamp meter to measure the current flowing into the controller. Clamp it around the positive cable from your solar array. This shows you the actual working amperage the system is producing right now.
Here’s what’s happening behind the scenes: your controller uses maximum power point tracking to automatically adjust its load on the panels, finding the sweet spot where voltage times current gives you the most watts. It’s constantly tweaking this balance as clouds pass or the sun angle changes. You’re capturing one snapshot of this dynamic process, which is why testing multiple times throughout the day gives you a fuller picture.
Write down both measurements, this operating voltage and current, along with the exact time. Multiply them together and you’ve got your real-world power output in watts.
Step 4: Calculate Actual Power Output
With your voltage and current readings in hand, it’s time to calculate the actual power your panels are producing. This is where you turn raw measurements into a number you can compare against your system’s rated capacity.
The math is straightforward: multiply your operating voltage (V) by your operating current (A) to get instantaneous power in watts (W). For example, if you measured 35.8 volts and 8.2 amps from a string during testing, you’re generating 293.6 watts at that moment. If you’re testing multiple strings, calculate each one separately, then add them together for total system output.
Now compare this real-world output to what your panels should produce under current conditions. A 400-watt panel doesn’t always deliver 400 watts, it needs full sun (1000 W/m²) and optimal temperature (typically 25°C). If your irradiance meter shows 850 W/m² and panels are running at 45°C, you’d expect around 320 watts after accounting for reduced sunlight and temperature losses.
This comparison reveals performance gaps. If your 400-watt panel is only producing 260 watts under 900 W/m² irradiance when it should deliver closer to 340 watts, something’s wrong, maybe shading, dirt, or a connection issue. That’s the kind of insight functional testing provides.
Step 5: Document and Repeat
Write down everything you just measured, voltage, current, power output, irradiance, ambient temperature, panel temperature, and the exact time. A simple spreadsheet works perfectly, or even a notebook if that’s your style. Snap photos of your meter displays as backup proof; you’ll thank yourself later when you question whether that number was really 18.3V or 18.8V.
Here’s the crucial part: one test tells you almost nothing. Run the same measurements at different times of day, morning, noon, and late afternoon, and across different weather conditions. Test on a clear day in spring, then again on a scorching summer afternoon or a cloudy winter morning. Patterns reveal what’s normal for your system versus what signals trouble. I learned this the hard way after panicking over “low” output on a slightly hazy day, only to realize my system was performing exactly as it should for those conditions. Repeat testing turns random data points into a reliable performance baseline you can trust.
Interpreting Your Results and Calculating Performance Ratio
Now that you’ve gathered all your measurements, it’s time to make sense of the numbers and figure out whether your solar system is actually delivering on its promise.
Performance Ratio is the single most useful metric for evaluating how well your DIY solar installation performs in the real world. Think of PR as your system’s efficiency score, it tells you what percentage of theoretical maximum energy your panels are actually producing after accounting for all the losses that naturally occur in any solar system.
Here’s how to calculate it. Take your actual measured power output and divide it by your system’s rated capacity, then adjust for the environmental conditions you recorded. The formula looks like this: PR = (Actual Power Output / Rated Power Capacity) × (1000 W/m² / Measured Irradiance). If you measured 850 watts from a 1000-watt array during testing at 900 W/m² irradiance, your calculation would be (850 / 1000) × (1000 / 900) = 0.94, or 94% PR. That’s excellent performance.
Note: Most DIY solar systems achieve PR values between 75% and 85%. Anything above 85% is exceptional, while values consistently below 70% warrant investigation.
What does your PR actually tell you? A PR of 80% means your system is converting 80% of the energy it theoretically could produce under perfect conditions into actual usable power. The missing 20% represents normal losses from wiring resistance, inverter conversion, temperature effects, and minor soiling. These losses are inevitable and expected.
Red flags to watch for include any PR measurement below 70%, which typically indicates a problem like significant shading, dirty panels, faulty connections, or inverter issues. A sudden drop of more than 10 percentage points compared to your baseline tests also signals something has changed. Inconsistent PR values across identical panels or strings point to localized problems, one panel might be failing or experiencing unique shading.
Temperature-related losses are normal and predictable. Most panels lose about 0.4% efficiency per degree Celsius above 25°C. If your panels are running hot on a summer afternoon, a slightly lower PR is expected physics, not a defect. Age-related decline of 0.5-1% per year is also normal for established systems.
Troubleshooting: What to Do When Performance Falls Short
When your functional performance testing reveals underperformance, don’t panic, most issues DIYers discover have straightforward fixes. Start with the simplest explanations first.
Shading is the usual suspect. Even partial shade on one panel can drag down an entire string. Walk your array at different times of day and note shadows from trees, chimneys, or new construction. Trimming branches or relocating panels solves most shading problems.
Dirty panels are next. Dust, bird droppings, and pollen block sunlight. A gentle wash with plain water and a soft brush can restore 5-10% of lost output immediately. I’ve seen DIYers gain back 15 watts per panel just from cleaning.
Check all electrical connections. Loose MC4 connectors, corroded terminals, or poorly crimped wires create resistance that shows up as voltage drops under load. Tighten connections, clean contacts with electrical cleaner, and replace any damaged cables.
If your voltage readings are correct but power output is low, check inverter losses. Inverters operating outside their optimal range or showing error codes need attention. Verify your inverter’s input voltage matches your string configuration.
Temperature effects are normal but worth understanding. Panels lose about 0.5% efficiency for every degree Celsius above 25°C. If you’re testing on a hot afternoon, factor this in before assuming there’s a problem.
For persistent issues that simple fixes don’t solve, use I-V curves to diagnose cell-level problems like bypass diode failures or internal panel damage. This deeper testing pinpoints whether panels need replacement.
Setting Up Ongoing Functional Performance Monitoring
One test tells you how your system performs today. A regular monitoring routine tells you if that performance is holding steady or slipping over time, catching small problems before they become expensive ones.
Test seasonally to capture your system’s behavior across different weather conditions. I recommend a full functional performance test at the start of each season, particularly after winter and before summer when output matters most. These quarterly checks reveal how dust buildup, changing sun angles, and temperature swings affect your performance ratio throughout the year. You’ll spot patterns that a single test would miss entirely.
Always test within a week after any installation work, component replacement, or maintenance. This establishes a new baseline and confirms your changes actually improved performance. If you clean your panels or adjust tilt angles, test before and after to quantify the difference.
Keep your data simple. A spreadsheet with columns for date, irradiance, temperature, voltage, current, calculated power, and PR works perfectly. Add a notes column for weather conditions or system changes. Plot your PR values over time, and you’ll see trends emerge. Spheral Solar’s calculator tools can help you track the right data without building spreadsheets from scratch.
Understanding the difference between what your meter vs electric bill shows becomes clearer when you have months of performance data. Consistent testing transforms guesswork into knowledge.
Common Questions About Functional Performance Testing
What are the best conditions for running functional performance testing?
Test during clear, sunny conditions between 10 AM and 2 PM when solar irradiance is strongest and most stable. Avoid testing on partly cloudy days, immediately after rain, or when panels are covered in dew, as fluctuating conditions make it difficult to get accurate baseline measurements.
How often should I conduct functional performance testing on my DIY solar system?
Test your system at least twice a year, once in spring and once in fall, to track seasonal performance changes. Also run tests after any maintenance work, system modifications, or if you notice unexpected drops in your energy production.
Do I need expensive equipment to perform functional performance testing?
No, you can conduct effective functional testing with a basic multimeter (around $30-50) and a smartphone app for irradiance estimates. While dedicated irradiance meters and clamp meters provide more precision, they’re not essential for DIY monitoring, accurate enough is better than not testing at all.
How do I know if my test results are accurate?
Compare your calculated Performance Ratio to the typical 75-85% range for residential installations, and look for consistency across multiple tests under similar conditions. If you’re getting wildly different readings each time or results that seem impossibly high or low, recheck your meter connections and environmental measurements.
Beyond these common questions, many DIYers wonder whether functional testing will void their equipment warranties. In most cases, non-invasive voltage and current measurements do not affect warranties, but always check your specific inverter and panel documentation before testing. Some manufacturers actually encourage performance monitoring as part of proper system maintenance.
Another frequent concern is whether you need to test every single panel individually. For most DIY installations, testing at the string level provides sufficient insight, you’ll only need individual panel testing if string-level results indicate a problem. This approach saves time while still catching the majority of performance issues that matter for your system’s overall health.
Running functional performance testing on your DIY solar system isn’t just about checking boxes, it’s about taking real ownership of your investment and building the skills to keep it running at peak efficiency for years to come. You don’t need to be an electrical engineer or spend thousands on professional testing equipment. Start with the basics: measure your voltage and current, record your conditions, calculate your power output. Each test you run builds your confidence and deepens your understanding of how your system actually behaves in the real world.
The beauty of regular functional testing is that it catches small problems before they become expensive ones. A 10% drop in performance might not be obvious in your daily usage, but your test data will flag it immediately. That early warning can mean the difference between tightening a loose connection and replacing a damaged panel. You’re not just maintaining your system, you’re maximizing the return on every dollar you invested in going solar.
I still remember the satisfaction I felt the first time I ran a complete performance test and saw my calculated Performance Ratio match my expectations. It’s that moment when the numbers confirm what you built actually works as designed. Your system becomes more than just panels on a roof, it becomes something you truly understand.
Don’t keep your results to yourself. Share your Performance Ratio with the community, ask questions when something doesn’t add up, and help others troubleshoot their own testing challenges. We’re all learning together, and your experience, whether it’s perfect results or discovering an issue, helps someone else on their solar journey.
How useful was this post?
Click on a star to rate it!
Average rating 0 / 5. Vote count: 0
No votes so far! Be the first to rate this post.
We are sorry that this post was not useful for you!
Let us improve this post!
Tell us how we can improve this post?
charlesnoble
Here at Spheral Solar, I’m a hands-on solar power enthusiast, constantly exploring and experimenting with DIY solutions. I’m dedicated to sharing my discoveries, insights, and even the bumps I hit along the way, all in the pursuit of a more sustainable future.
How to Wire and Configure a Battery Inverter 3 Phase… by Charlesnoble September 16, 2026 Charging a battery bank with a 3-phase inverter requires connecting your inverter’s AC output to a compatible battery charger or hybrid inverter system that can convert the 3-phase power back to DC for storage. Most DIY solar setups achieve this by using a hybrid inverter that handles both solar input…
Why Two Solar Panels Beat One Every Time (Parallel… by Charlesnoble June 22, 2026 Connect your panels to a charge controller or battery system by running positive terminals to positive and negative to negative. This parallel configuration doubles your available current (amperage) while keeping voltage the same, which is exactly what you need when your system demands more power than a single panel can…
6 Best Solar Spot Lights of 2026, Tested and Reviewed by Charlesnoble August 8, 2026 After testing dozens of solar spotlights in real-world conditions throughout 2026, the AloftSun Solar Motion Sensor Outdoor Lights emerged as the top overall choice for most homeowners, thanks to its reliable performance and versatility across different landscape lighting scenarios. But picking the right solar spotlight depends entirely on what you’re…
How to Connect SolarEdge to Ethernet for Seamless… by Charlesnoble July 9, 2026 Connecting your SolarEdge inverter to your home network via Ethernet cable takes about 15 minutes and gives you real-time access to your system’s performance data from any device with internet access. You’ll plug a standard Ethernet cable into the RJ45 port on your inverter (usually labeled “LAN” or “Ethernet”), run…
How to Install a Whole House Ventilation System… by Charlesnoble July 12, 2026 Installing a whole house ventilation system powered by solar takes about 6 to 8 hours for a moderately skilled DIYer and delivers continuous fresh air circulation without touching your electric bill. The core method involves mounting a solar panel on your roof to power an intake or exhaust fan, routing…
Why Is My Solar Inverter Showing Arc Fault E050?… by Charlesnoble September 9, 2026 Nine times out of ten, an E050 arc fault error on your solar inverter means a loose connection somewhere in your DC wiring. Before you panic or call an expensive technician, check every MC4 connector between your panels and inverter. A single connection that wasn’t snapped fully closed or has…
Subscribe for handpicked DIY projects, exclusive tips, and giveaways.
Nine times out of ten, an RV generator that won’t start has a stale fuel problem. If your generator hasn’t run in more than 30 days, degraded gasoline is likely gumming up the carburetor and preventing ignition. Before you panic or call for expensive roadside service, try this: turn on the generator’s fuel valve (if… Read more: RV Generator Troubleshooting: Common Problems and How to Fix Them
A 5kW solar system occupies between 250 and 350 square feet of roof or ground space and produces roughly 20 to 25 kilowatt-hours of electricity per day in most U.S. locations. That’s enough to power a typical three-bedroom home with moderate energy use, though your exact needs depend on your daily consumption patterns, climate zone,… Read more: How to Size a 5kW Solar System for Your Home or RV
Installing a home solar system yourself takes 2-4 weekends for an average 5kW setup, requires solid electrical knowledge and comfort working at heights, and can save you $5,000-$8,000 in labor costs if you tackle everything except the final utility interconnection. The process breaks down into five main phases: permitting and design, mounting the racking system,… Read more: Solar Power Installation Step by Step: Complete DIY Guide From Start to Finish